13. One-click Inspection
13.1 Introduction to One-click Inspection
13.1.1 Overview
One-click inspection is used to check the health status of the cloud platform. By scanning the inspection items of the management node and compute node, including the CPU, memory, disk usage, etc. of platform nodes, it makes it easier for administrators to evaluate problems.
13.1.2 Content of One-click Inspection
Inspection mainly scans the entire platform, including time source synchronization check of the management node, CPU usage rate check, memory usage rate check, and disk usage rate check; physical machine CPU average usage check, physical machine memory usage rate check, physical machine system disk used capacity check of the compute node, etc. The contents of one-click inspection are as follows:
| Inspection Type | Inspection Item | Meaning | Meaning | Inspection Suggestion |
|---|---|---|---|---|
| Management Node | Time Source Consistency Check | Check whether time source synchronization is set up | Provide the current time source and recommended time source | If the time source is found to be inconsistent with the time source of other nodes in the cluster or the physical machine clock is not synchronized with the time source, please SSH login to the corresponding system to check the time source configuration |
| CPU Usage Rate Check | Check the CPU usage proportion of the cloud platform management node | Provide the current proportion, and provide the top five processes with the highest usage rate if it exceeds 80% | If the CPU usage rate of the cloud platform exceeds 80% continuously within 10 minutes, please contact the relevant personnel of the platform for hot upgrade or problem evaluation to continue using the platform normally | |
| Memory Usage Rate Check | Check the memory usage proportion of the cloud platform management node | Provide the current proportion, and provide the top five processes with the highest usage rate if it exceeds 80% | If the memory usage rate of the cloud platform exceeds 80% continuously within 10 minutes, please contact the relevant personnel of the platform for hot upgrade or problem evaluation to continue using the platform normally | |
| Disk Capacity Check | Check the usage proportion of the disk used by the cloud platform management node | 提Provide the current proportion, and provide the top ten file paths and file sizes with the highest proportion if it exceeds 70% | If it is detected that the disk data capacity of the cloud platform has occupied more than 70% of the disk space where the management node is located, please contact the relevant personnel of the platform for disk inspection and expansion as soon as possible to continue using the platform function normally | |
| Management Service Check | Check the operation status of cloud platform management services | Provide the current service name and status, and provide the IP address of the abnormal node if the service is abnormal | If the service status is abnormal, please SSH login to the corresponding system according to the provided node information to check the status of the service | |
| Compute Node | Physical Machine CPU Average Usage Check | Check the average usage rate of physical machine CPUs on the cloud platform | Provide the current proportion, and provide the top five processes with the highest usage rate if it exceeds 80% | If the average usage rate of physical machine CPUs on the cloud platform exceeds 70%, please log in to the physical machine system to confirm whether there are abnormal processes on the physical machine. If no abnormal processes exist, it is recommended to consider expanding the cluster |
| Physical Machine Memory Usage Rate Check | Check the average memory usage rate of physical machines on the cloud platform | Provide the current proportion, and provide the top five processes with the highest usage rate if it exceeds 80% | If the memory usage rate of physical machines on the cloud platform exceeds 80% or even 90%, please log in to the physical machine system immediately to check whether there are business exceptions on the physical machine and optimize running services as needed. If necessary, it is recommended to expand the cluster | |
| Physical Machine System Disk Used Capacity Check | Check the usage rate and usage amount of the physical machine system disk on the cloud platform | Provide the current proportion, and provide the top ten file paths and file sizes with the highest proportion if it exceeds 70% | If the usage rate of the physical machine system disk on the cloud platform exceeds 70% or even 90%, please log in to the physical machine system immediately to check and clean up data that has no impact on the business |
13.2 Create One-click Inspection
Cloud platform users can create one-click inspections through the console. After entering the one-click inspection console through the navigation bar, click the “Start One-click Inspection” button to enter the create inspection pop-up window, as shown below:
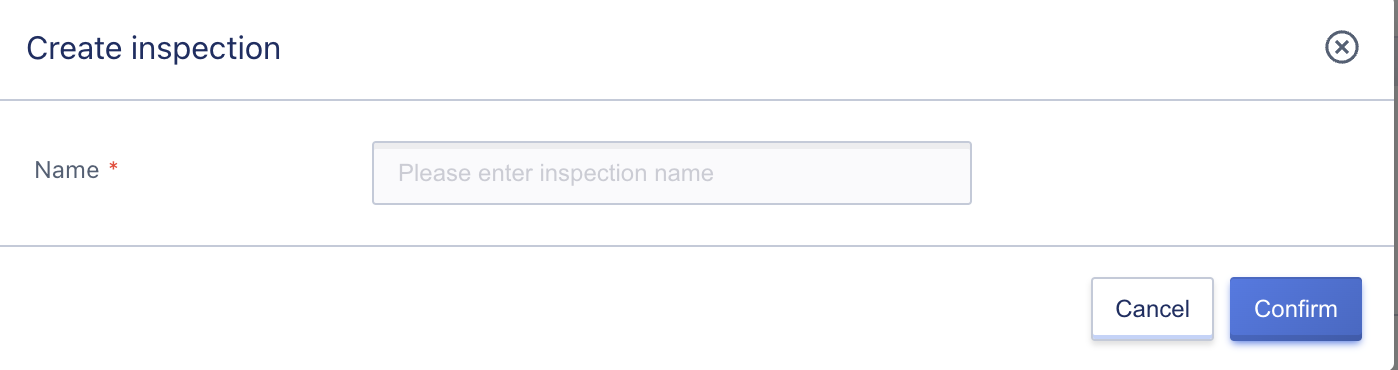
- Name/Note: A name must be specified when creating an inspection.
- Confirm Creation: After clicking on “Confirm”, the user will be returned to the One-Click Inspection list page. Normally, after a successful creation, the status will show as “In Progress”, and upon completion, it will show as “Completed”.
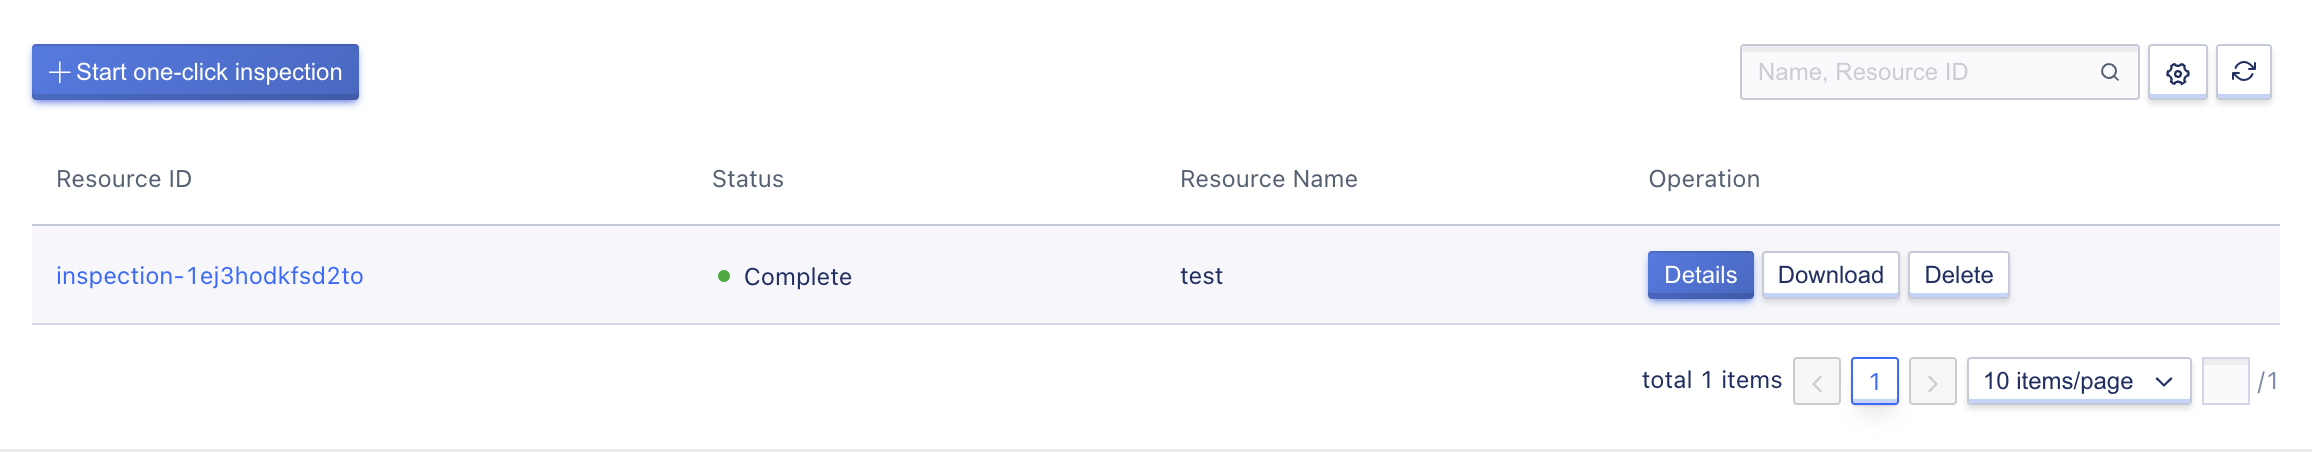
13.3 Viewing One-Click Inspections
By navigating to the One-Click Inspection Control Panel, users can view the inspection list and related information, including inspection report ID, status, inspection report name, creation time, report generation time, and action items. The action items include viewing report details, downloading reports, and deleting reports.
- Inspection Report ID: The inspection report ID is a globally unique identifier;
- Status: The status of the inspection report, including in progress and completed;
- Inspection Report Name: The name of the inspection report, which must be specified during creation;
- Creation Time: Refers to the time the inspection report was created;
- Report Generation Time: Refers to the time taken to generate the inspection report from creation to completion;
13.3.1 One-Click Inspection List
The inspection report ID can be copied and used for operations in any state. Users can copy the inspection report ID by clicking on the “Copy” button located to the right of each inspection report ID on the inspection list page, as shown in the figure below:
13.3.2 One-Click Inspection Details
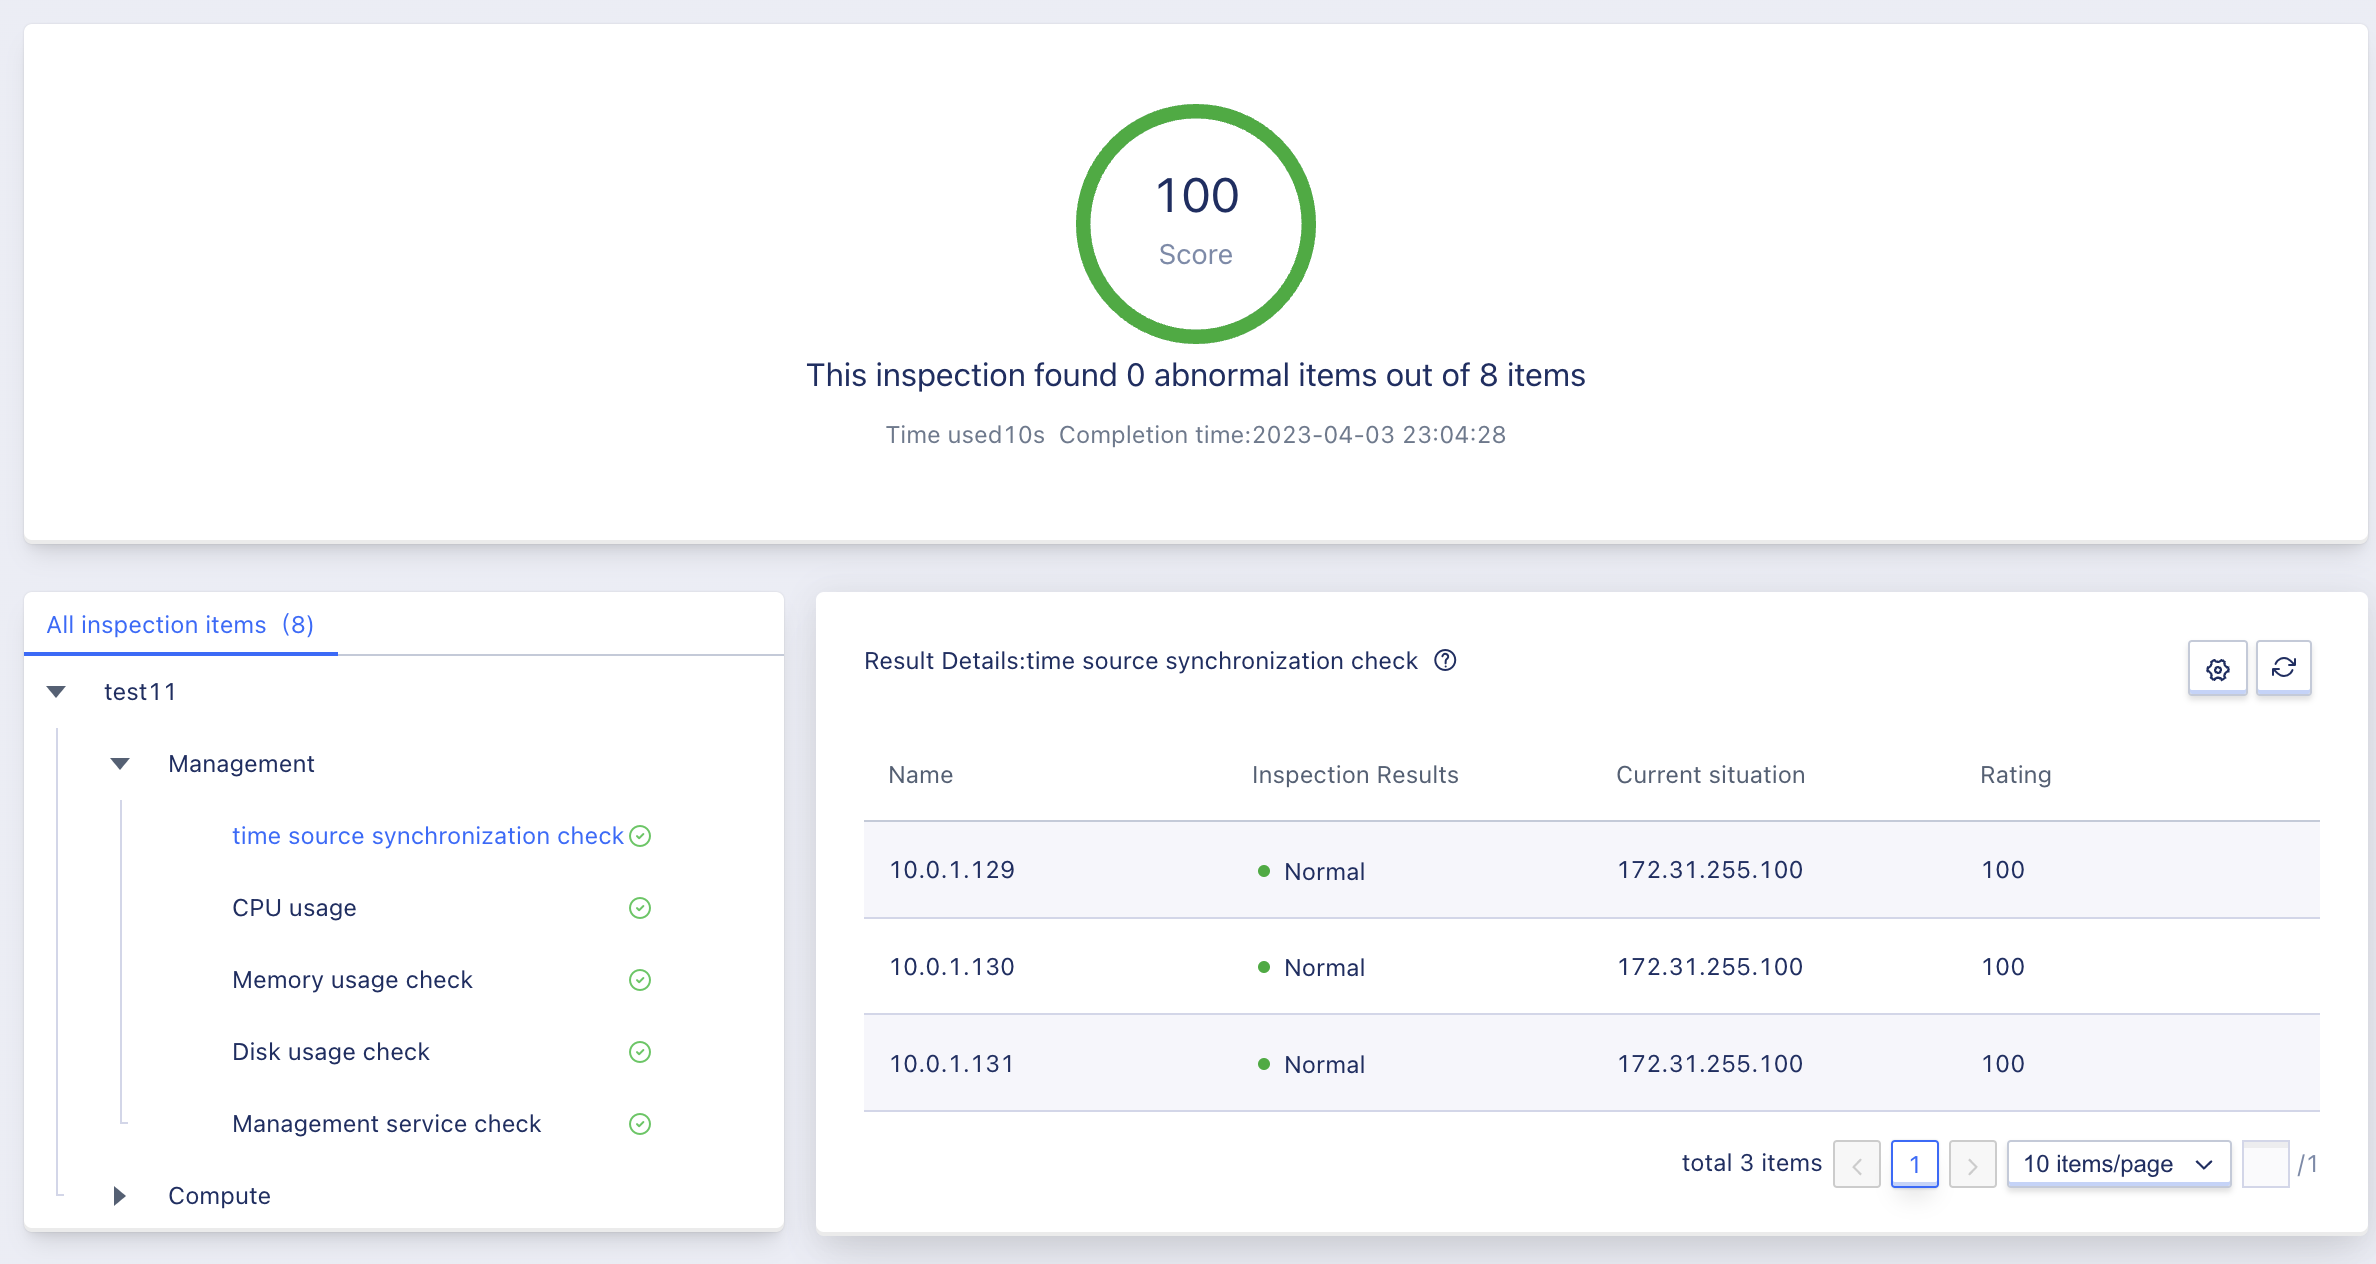
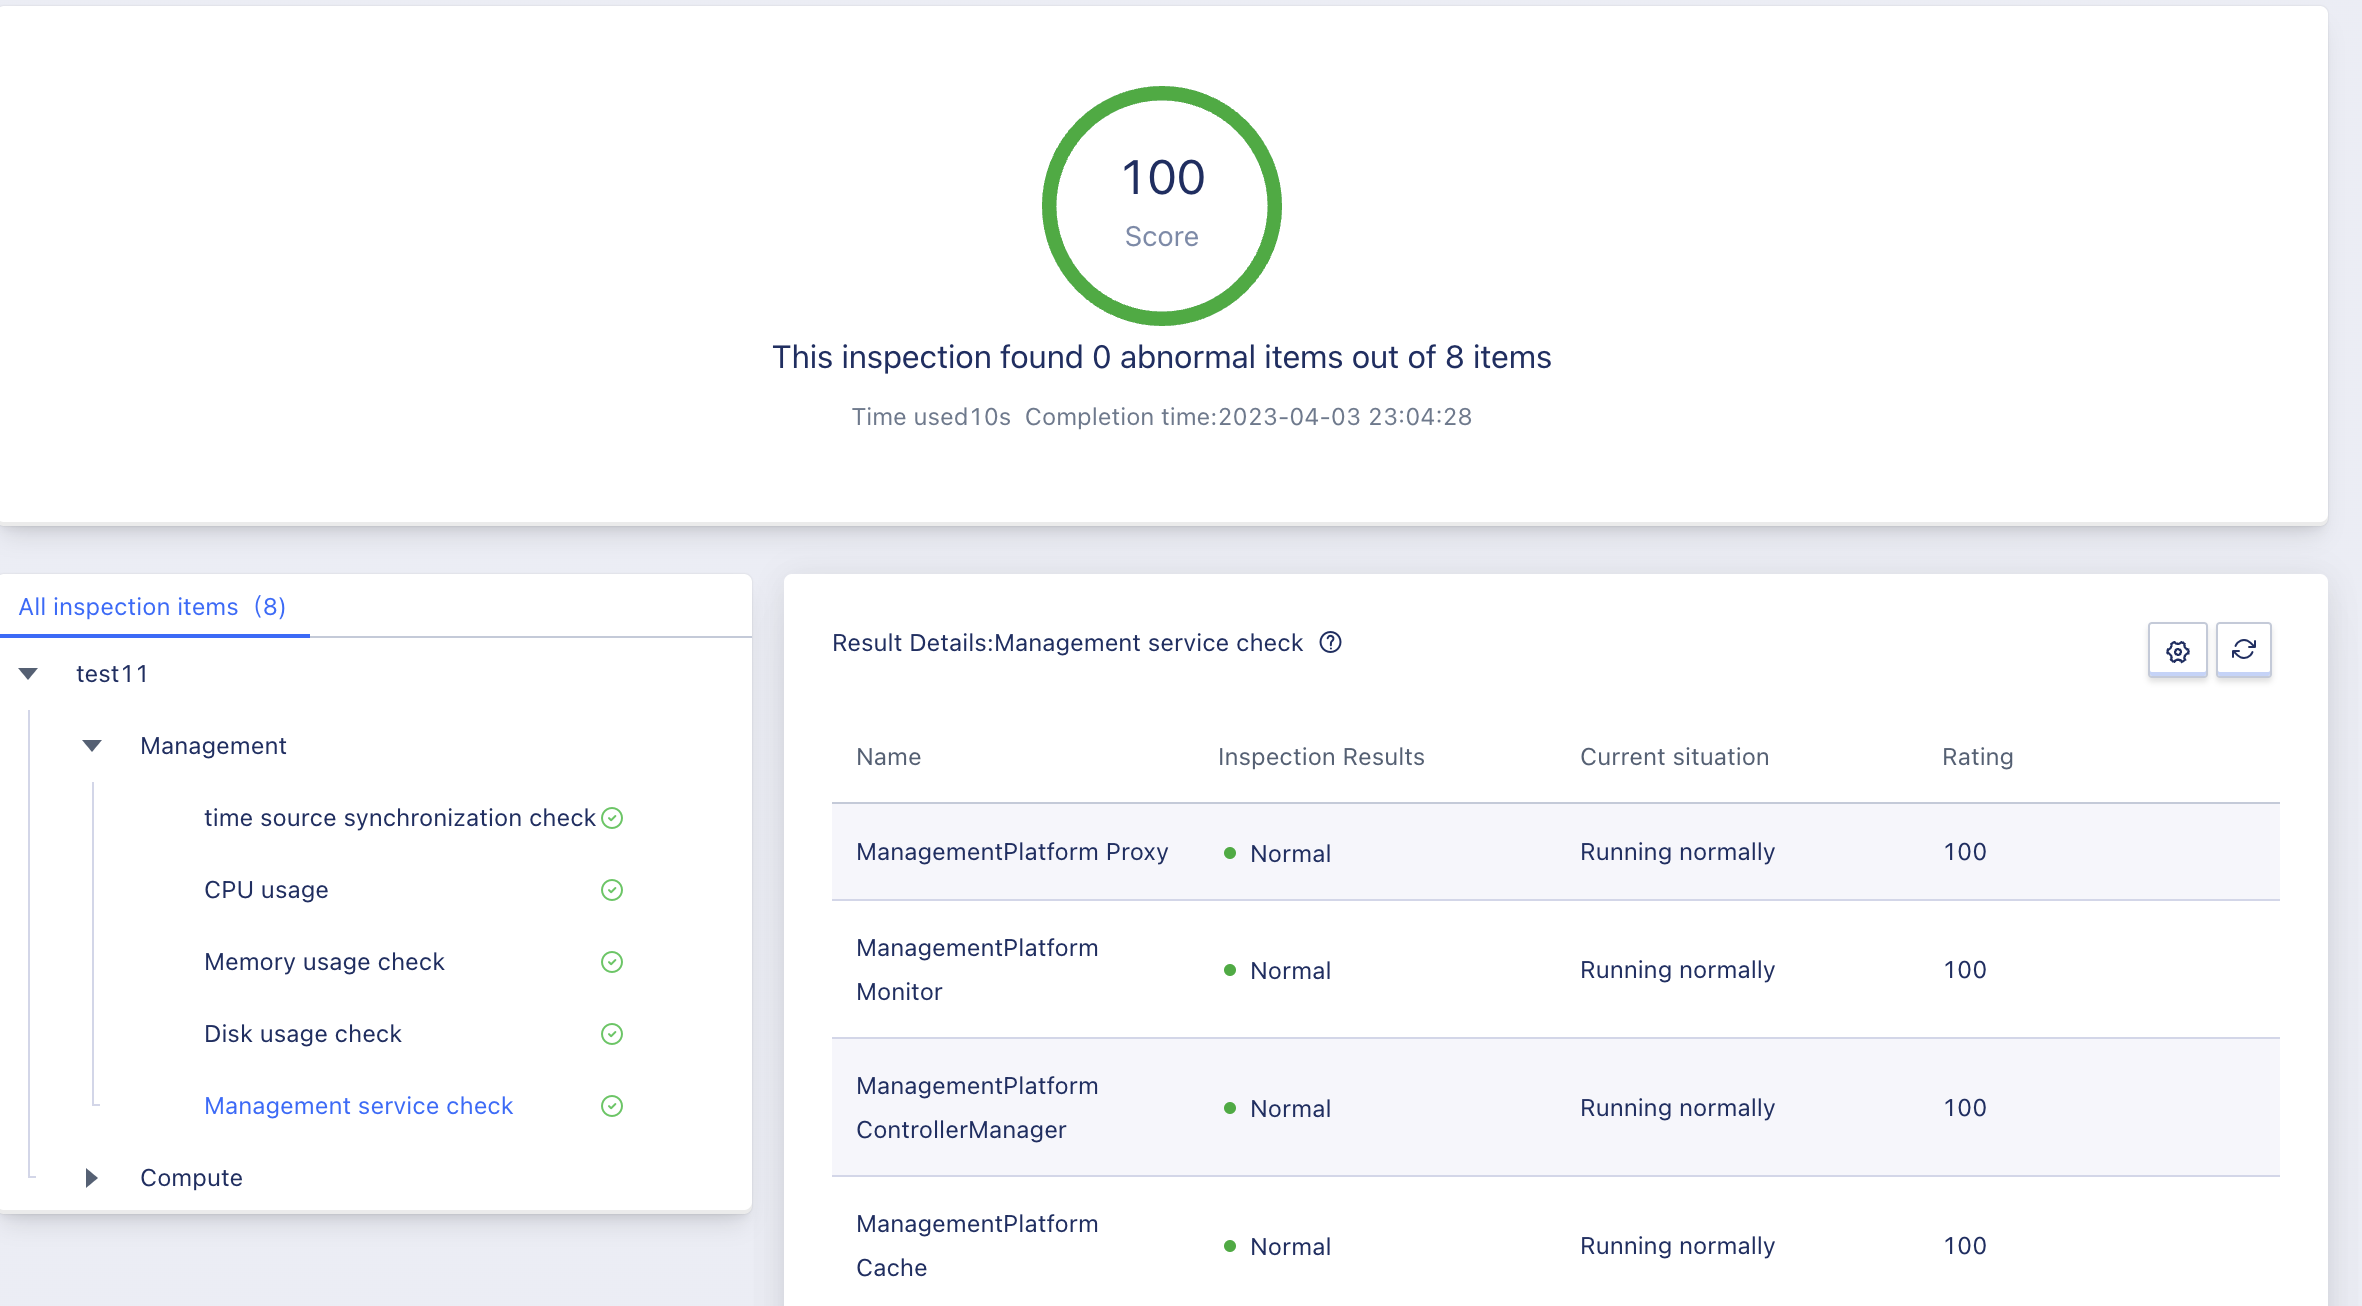
Users can click on the inspection report ID on the inspection list or the detail button on the operation bar to access the One-Click Inspection Details page. The details page displays the inspection score, number of inspection items, number of exceptions, inspection completion time, and all inspection items. Expanding the management and calculation nodes allows users to view detailed data, including names, inspection results, current status, and scores. When the inspection result is abnormal, corresponding recommendations will be displayed below the result details. The One-Click Inspection Details are shown in the figure below:
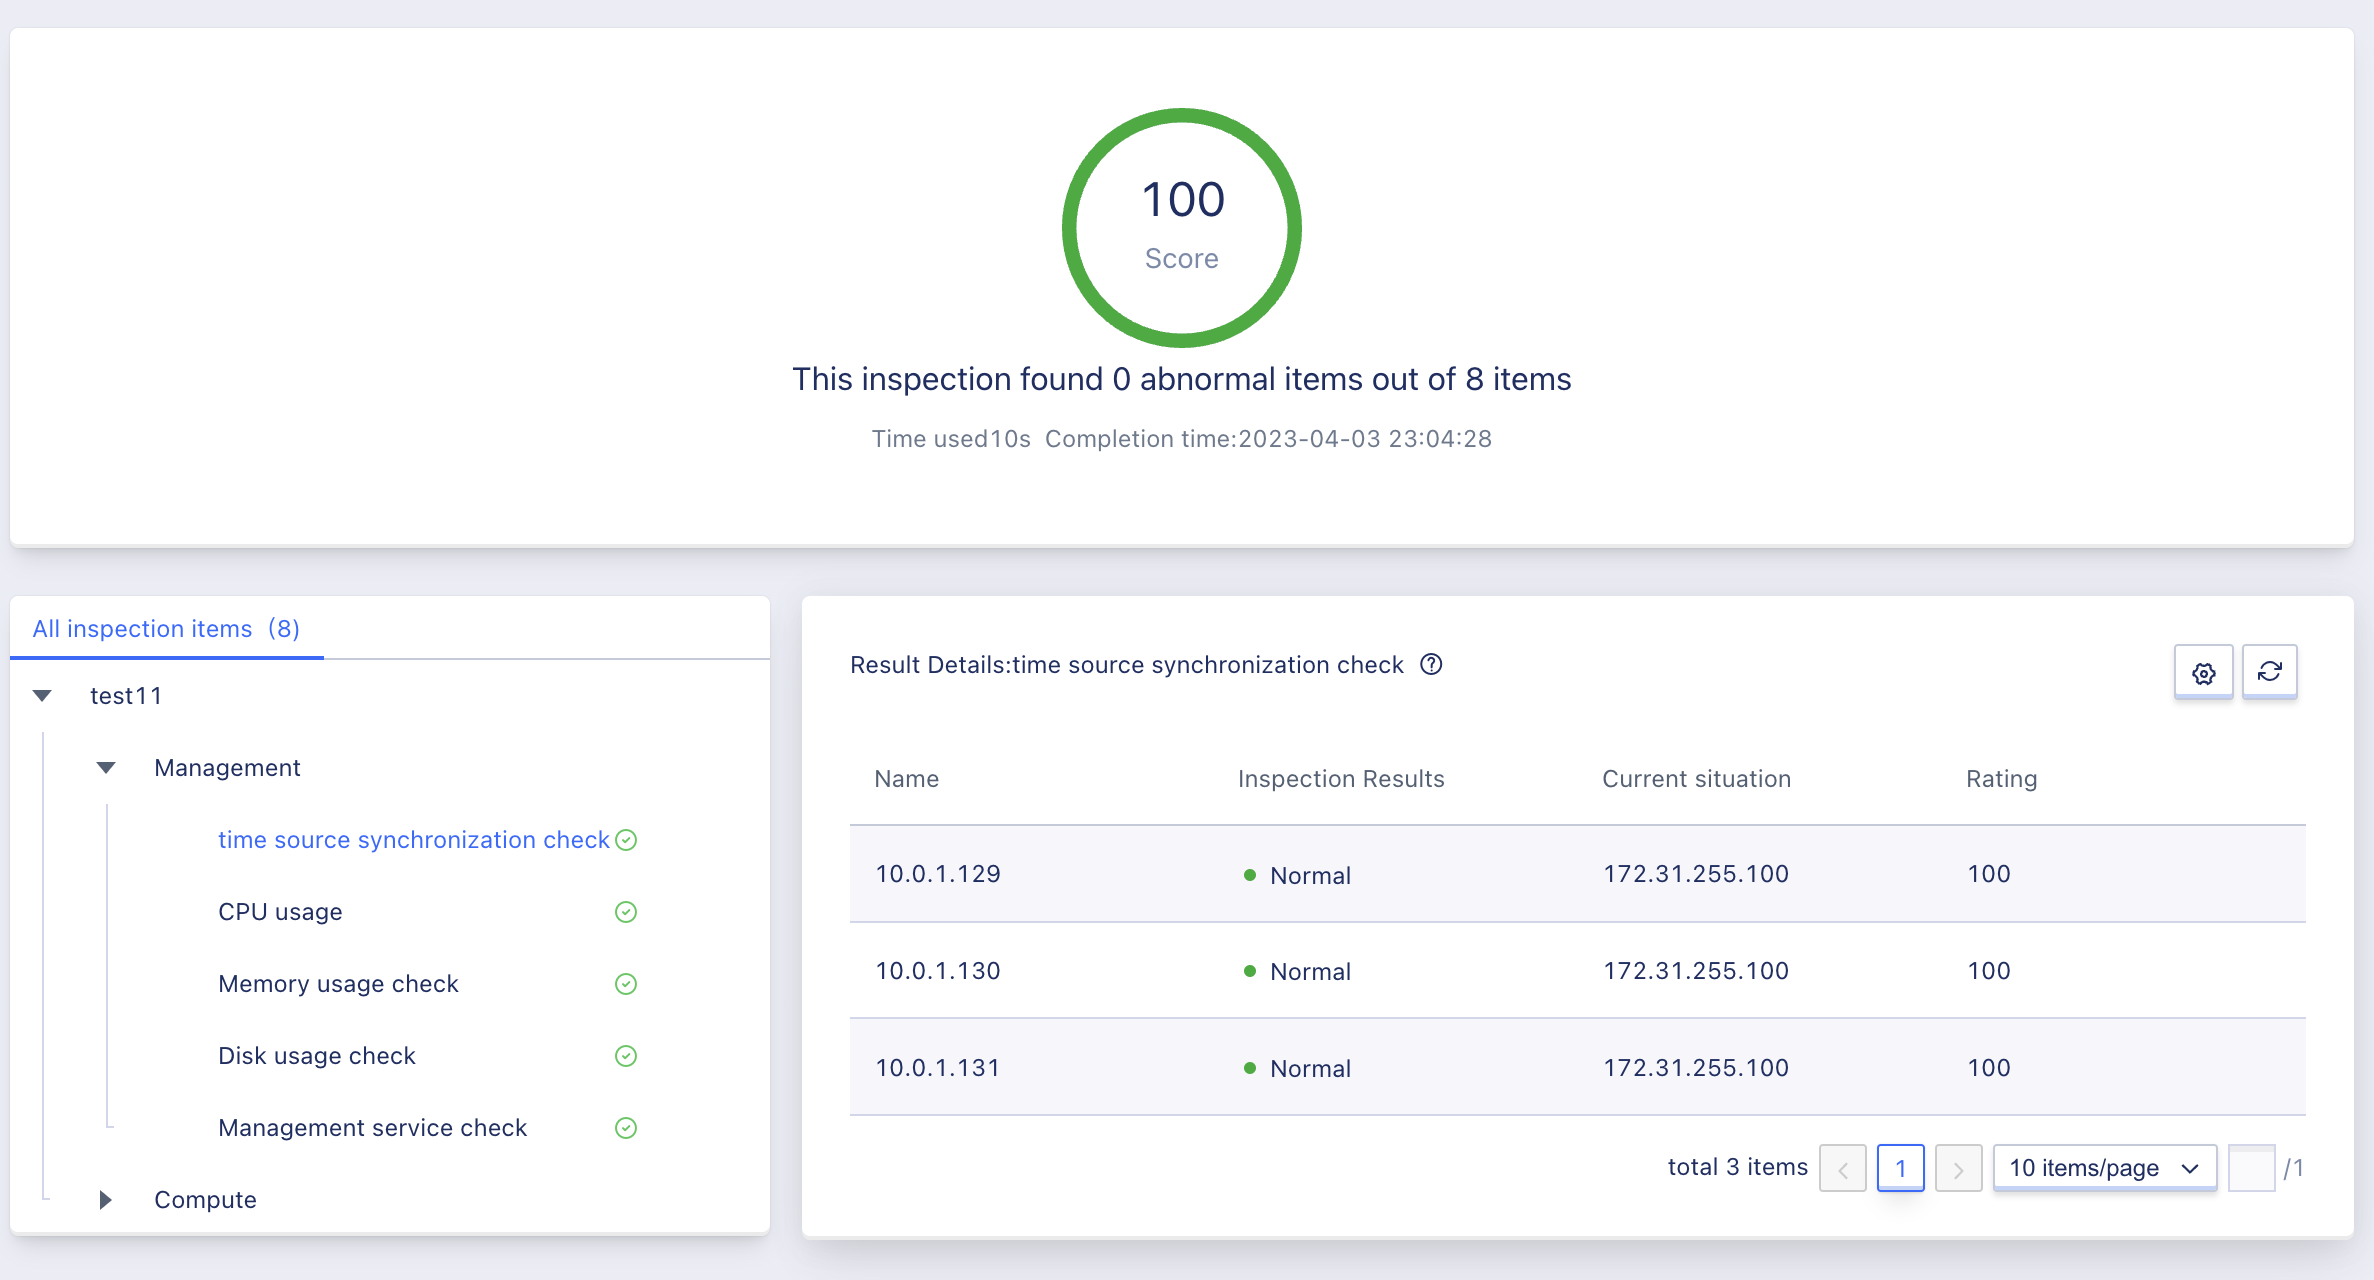
13.3.3 Time Source Synchronization Check
Checks whether time source synchronization is set up. When the inspection result is normal, it is displayed as shown in the figure below. When the inspection result is abnormal, the inspection result is a warning, and the status is synchronization exception.
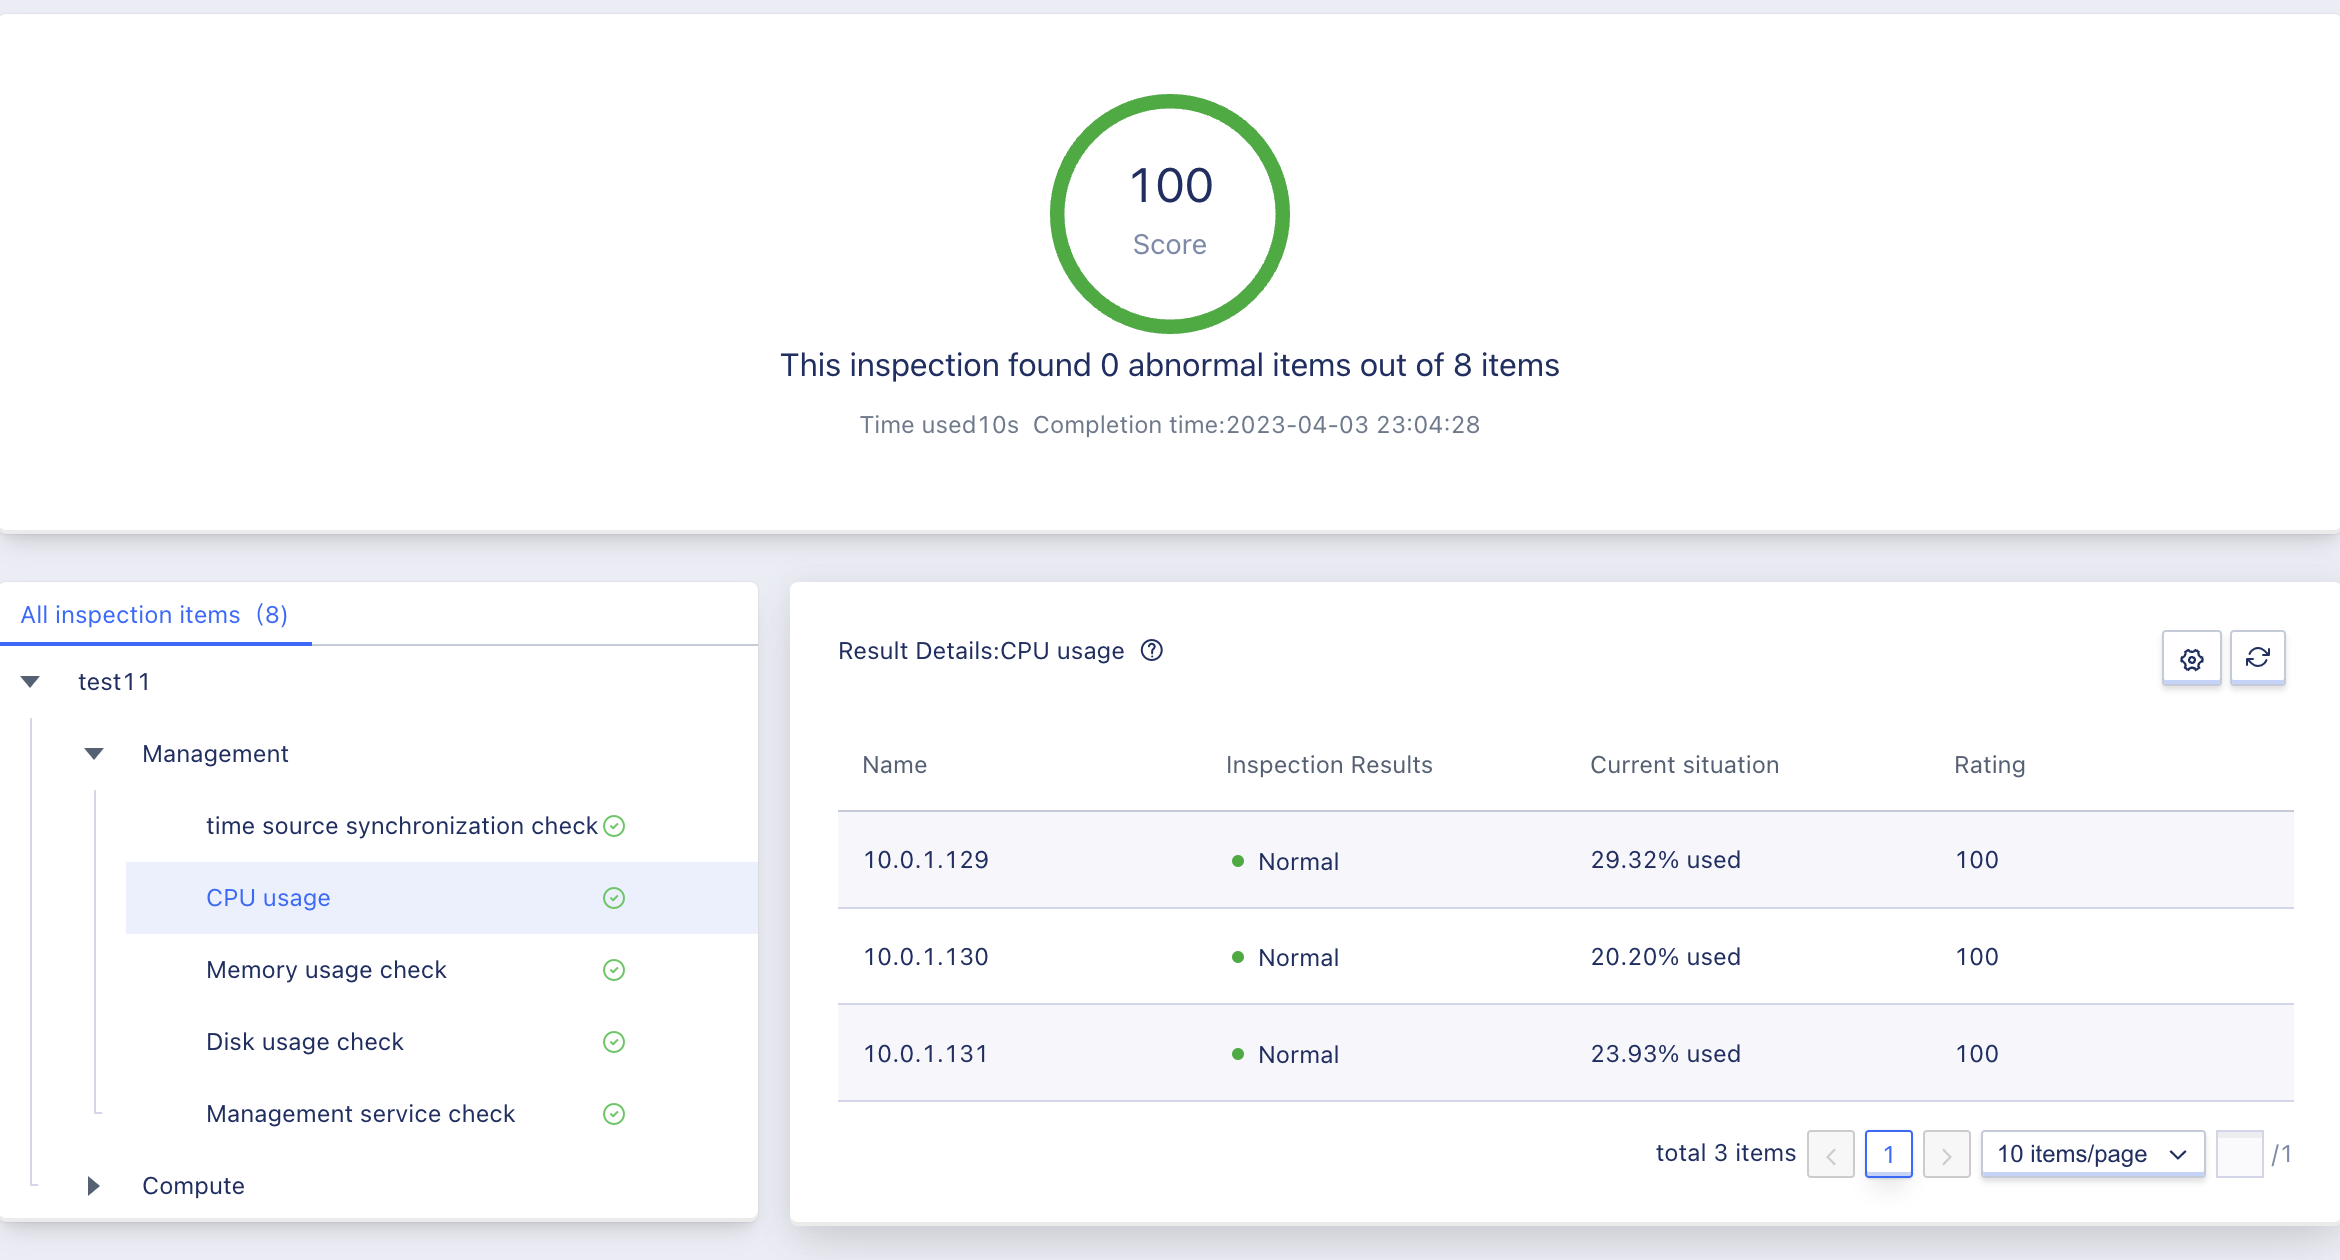
13.3.4 CPU Usage Rate
Checks the percentage of CPU usage on the cloud platform management node. When the inspection result is normal, it is displayed as shown in the figure below. When the inspection result is abnormal, the inspection result is a warning, and there is a question mark icon in the upper right corner. Moving the mouse over the question mark icon will display the main file name, PID, and usage that caused the abnormal result.
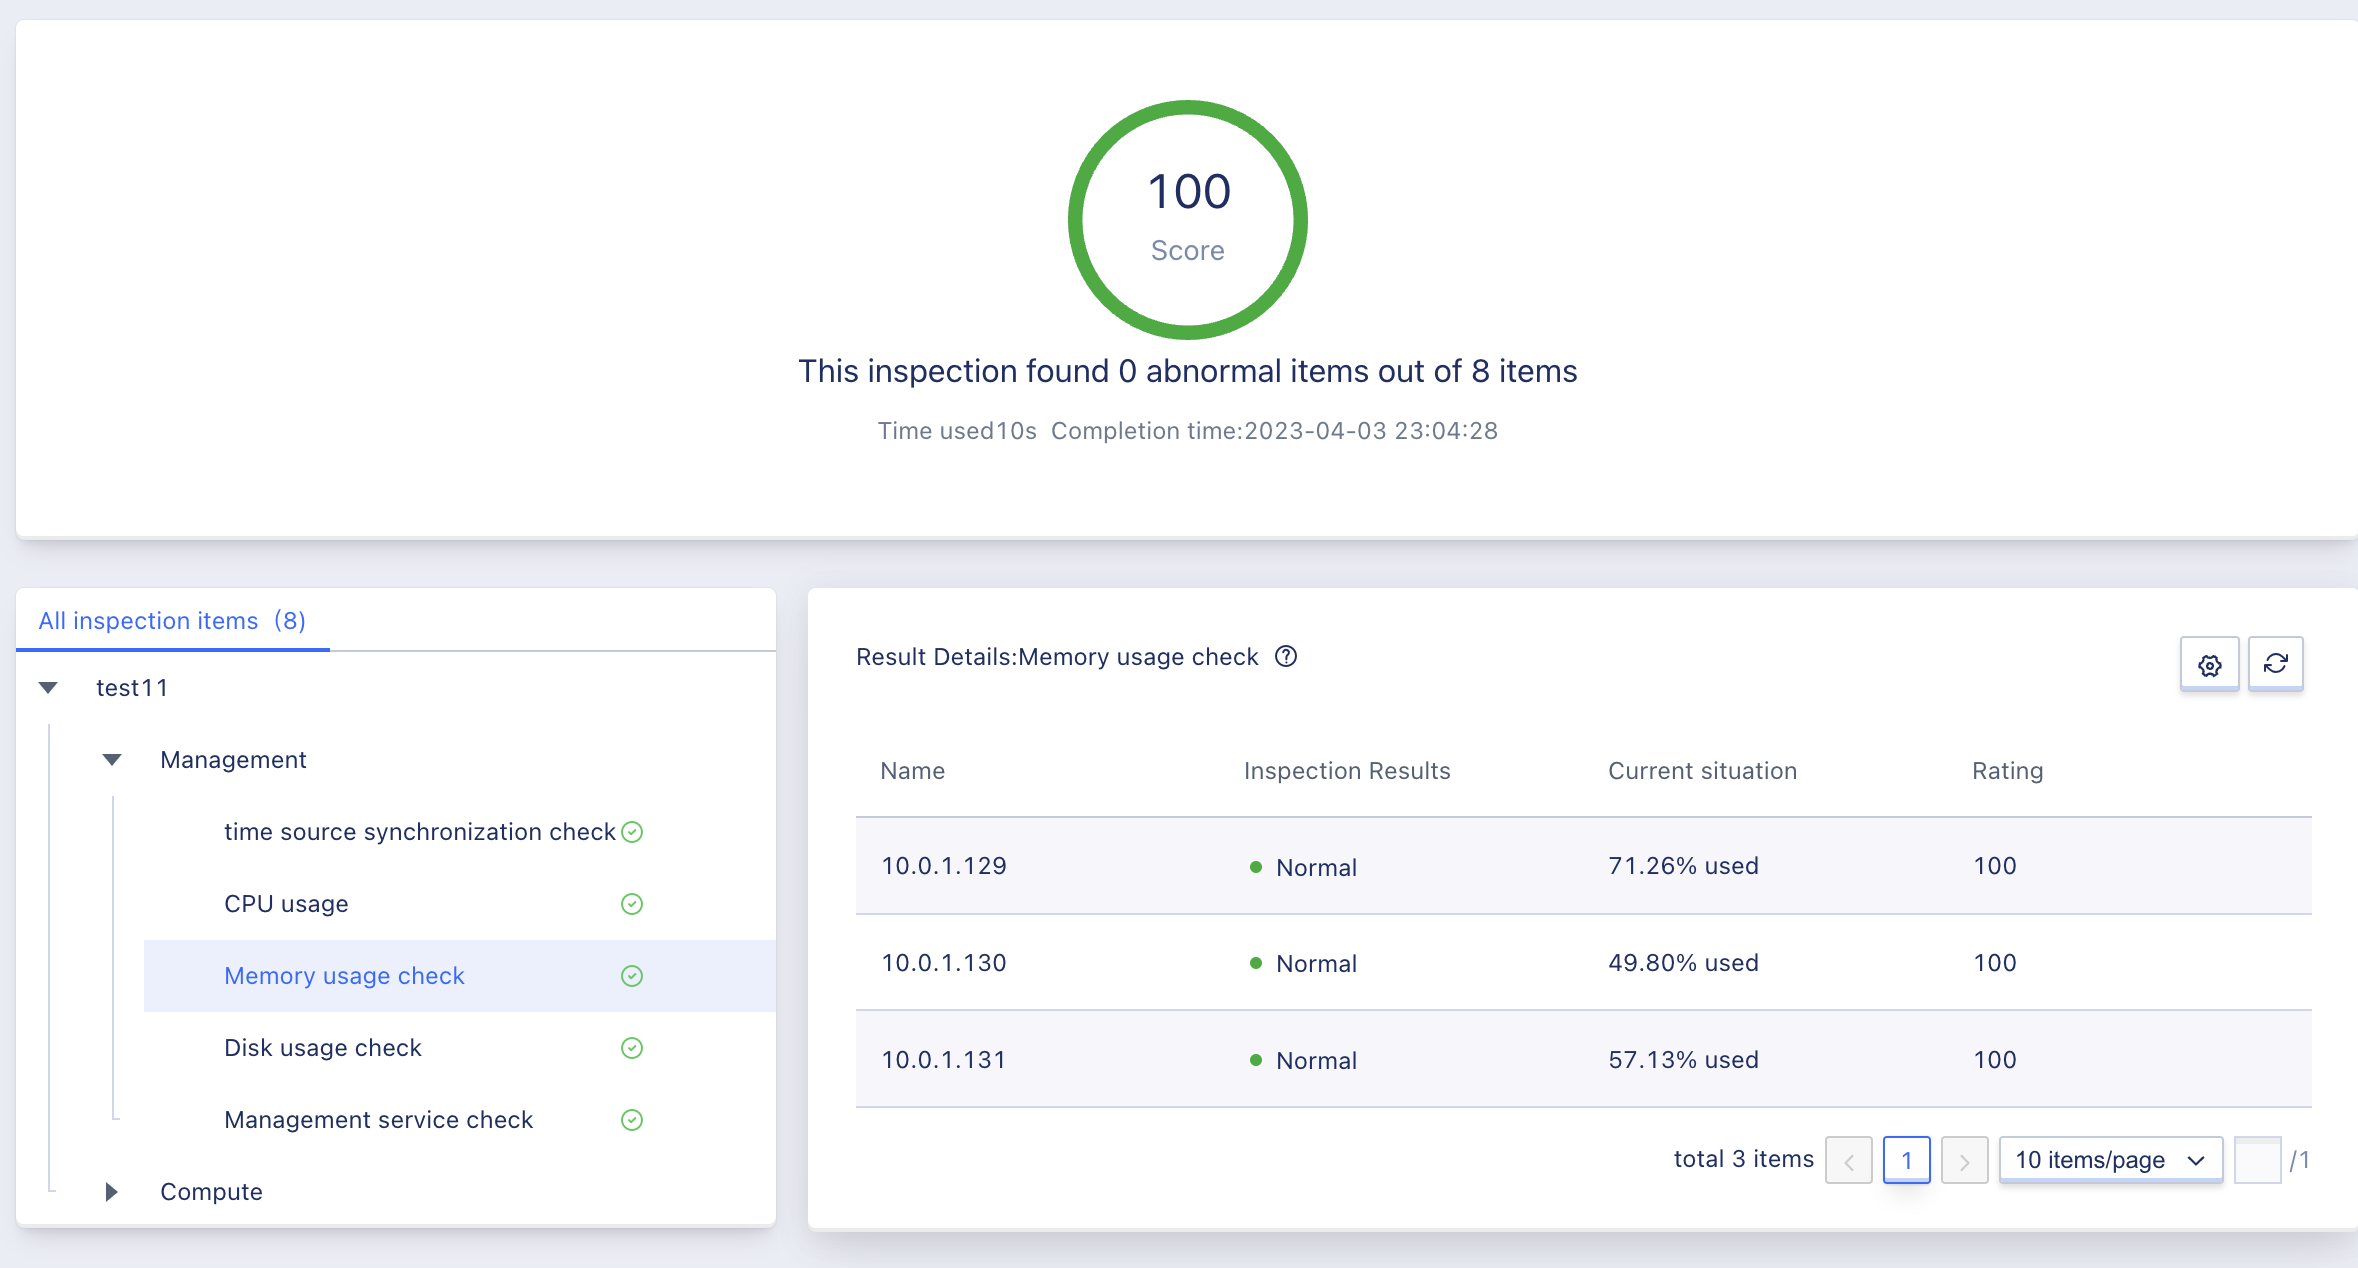
13.3.5 Memory Usage Rate Check
Checks the percentage of memory usage on the cloud platform management node. When the inspection result is normal, it is displayed as shown in the figure below. When the inspection result is abnormal, the inspection result is a warning, and there is a question mark icon in the upper right corner. Moving the mouse over the question mark icon will display the main file name, PID, and usage that caused the abnormal result.
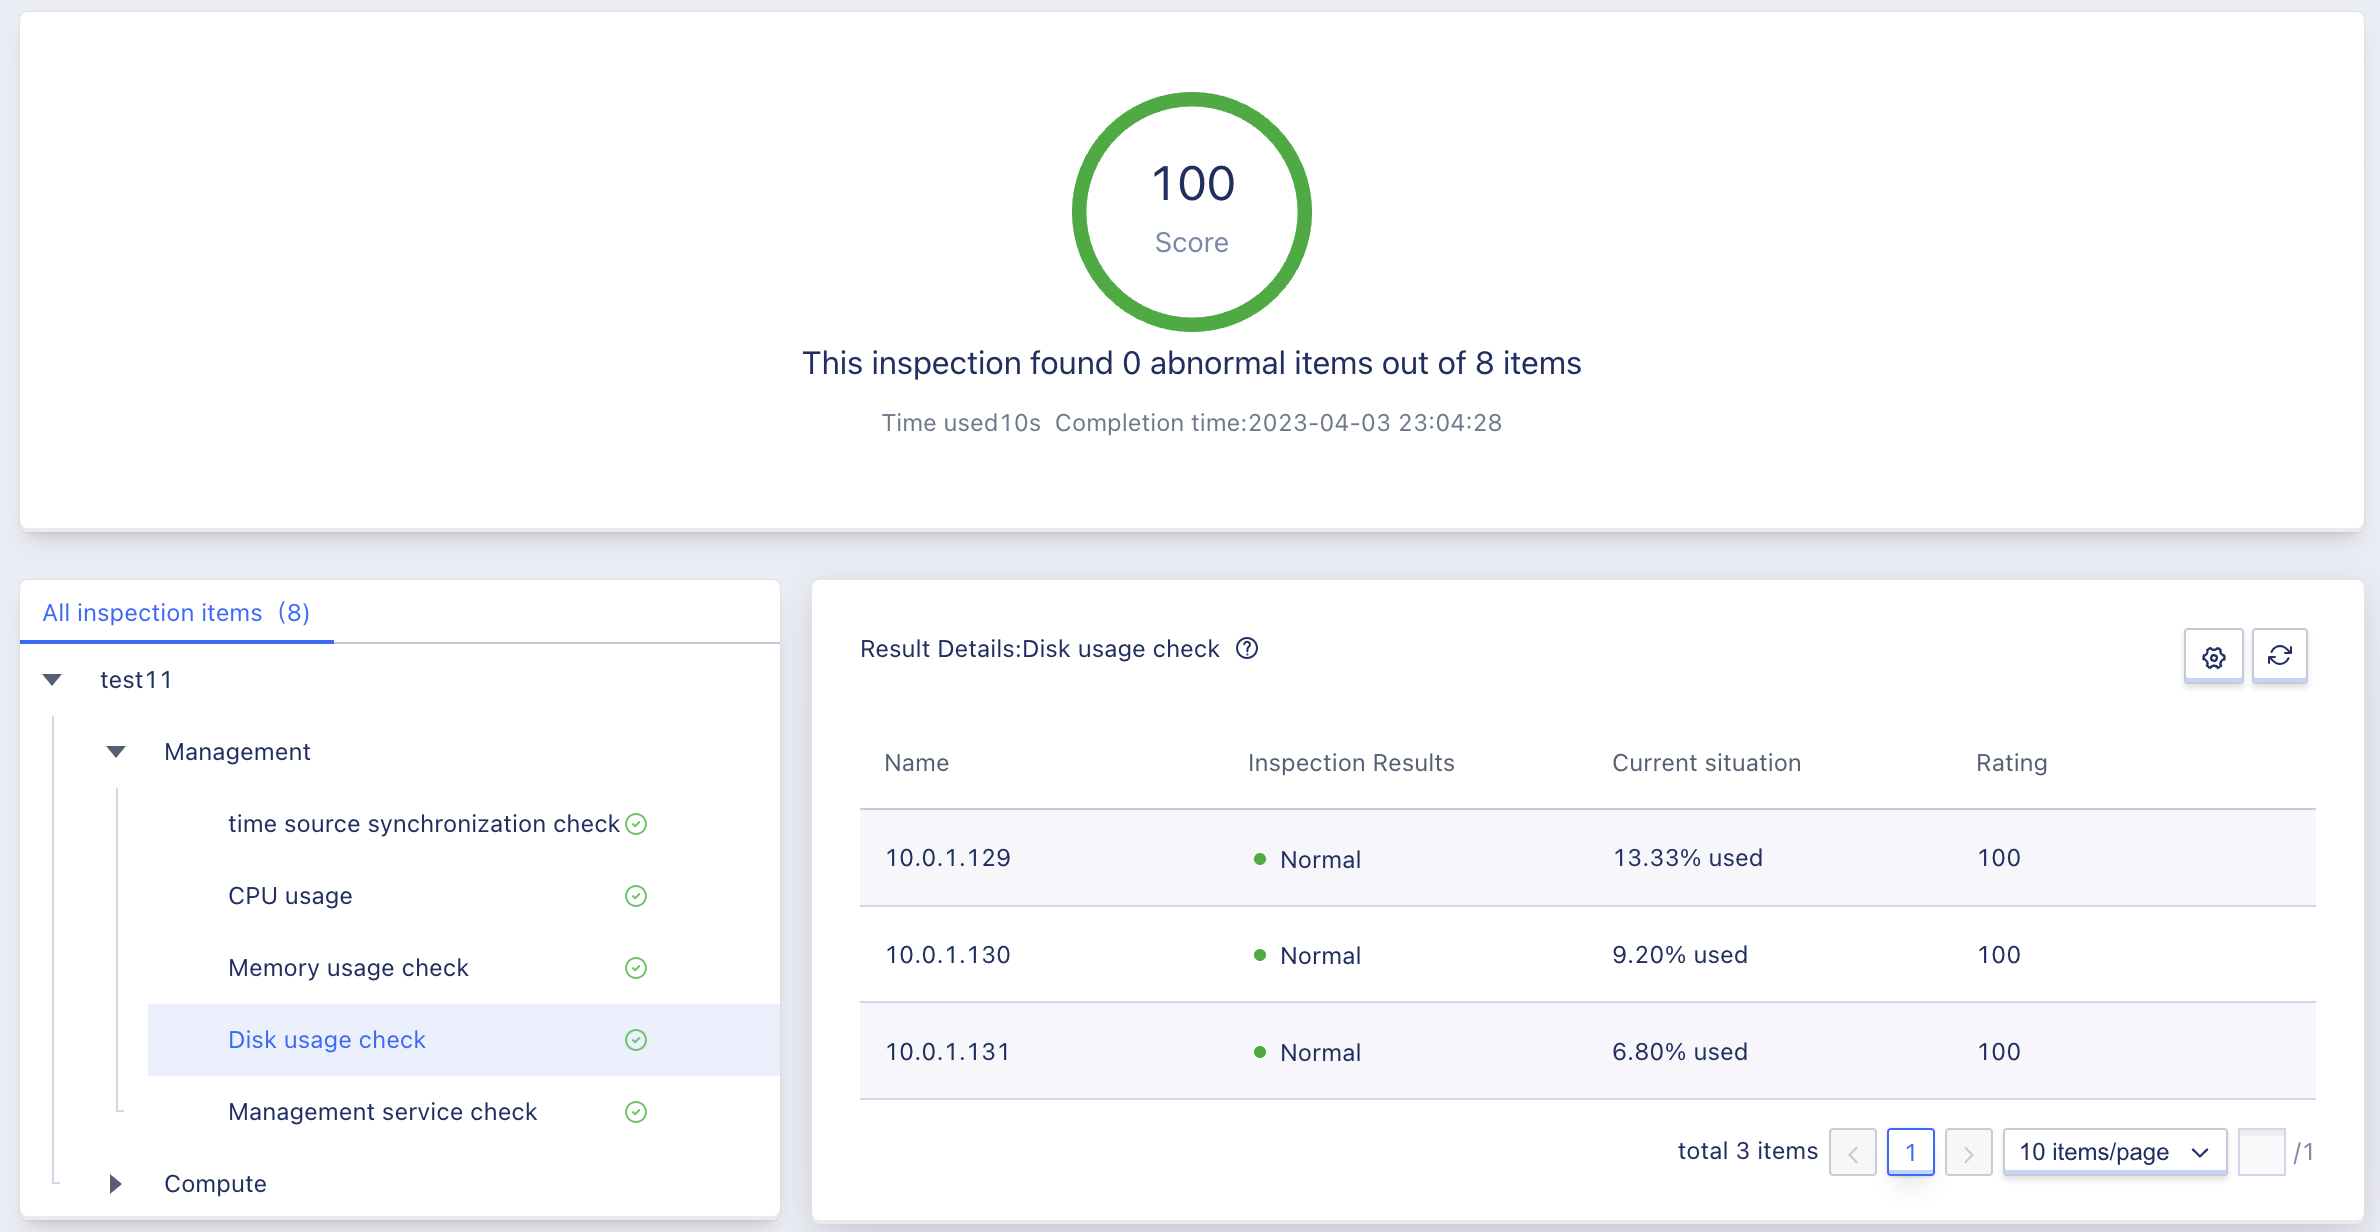
13.3.6 Disk Usage Check
Checks the percentage of disk usage on the cloud platform management node. When the inspection result is normal, it is displayed as shown in the figure below. When the inspection result is abnormal, the inspection result is a warning, and there is a question mark icon in the upper right corner. Moving the mouse over the question mark icon will display the main file name and size that caused the abnormal result.
13.3.7 Management Service Check
Checks the usage percentage of disk on the cloud platform management node. When the inspection result is normal, it is displayed as shown in the figure below. When the inspection result is abnormal, the inspection result is a warning, and there is a question mark icon in the upper right corner. Moving the mouse over the question mark icon will display the main file name and size that caused the abnormal result.
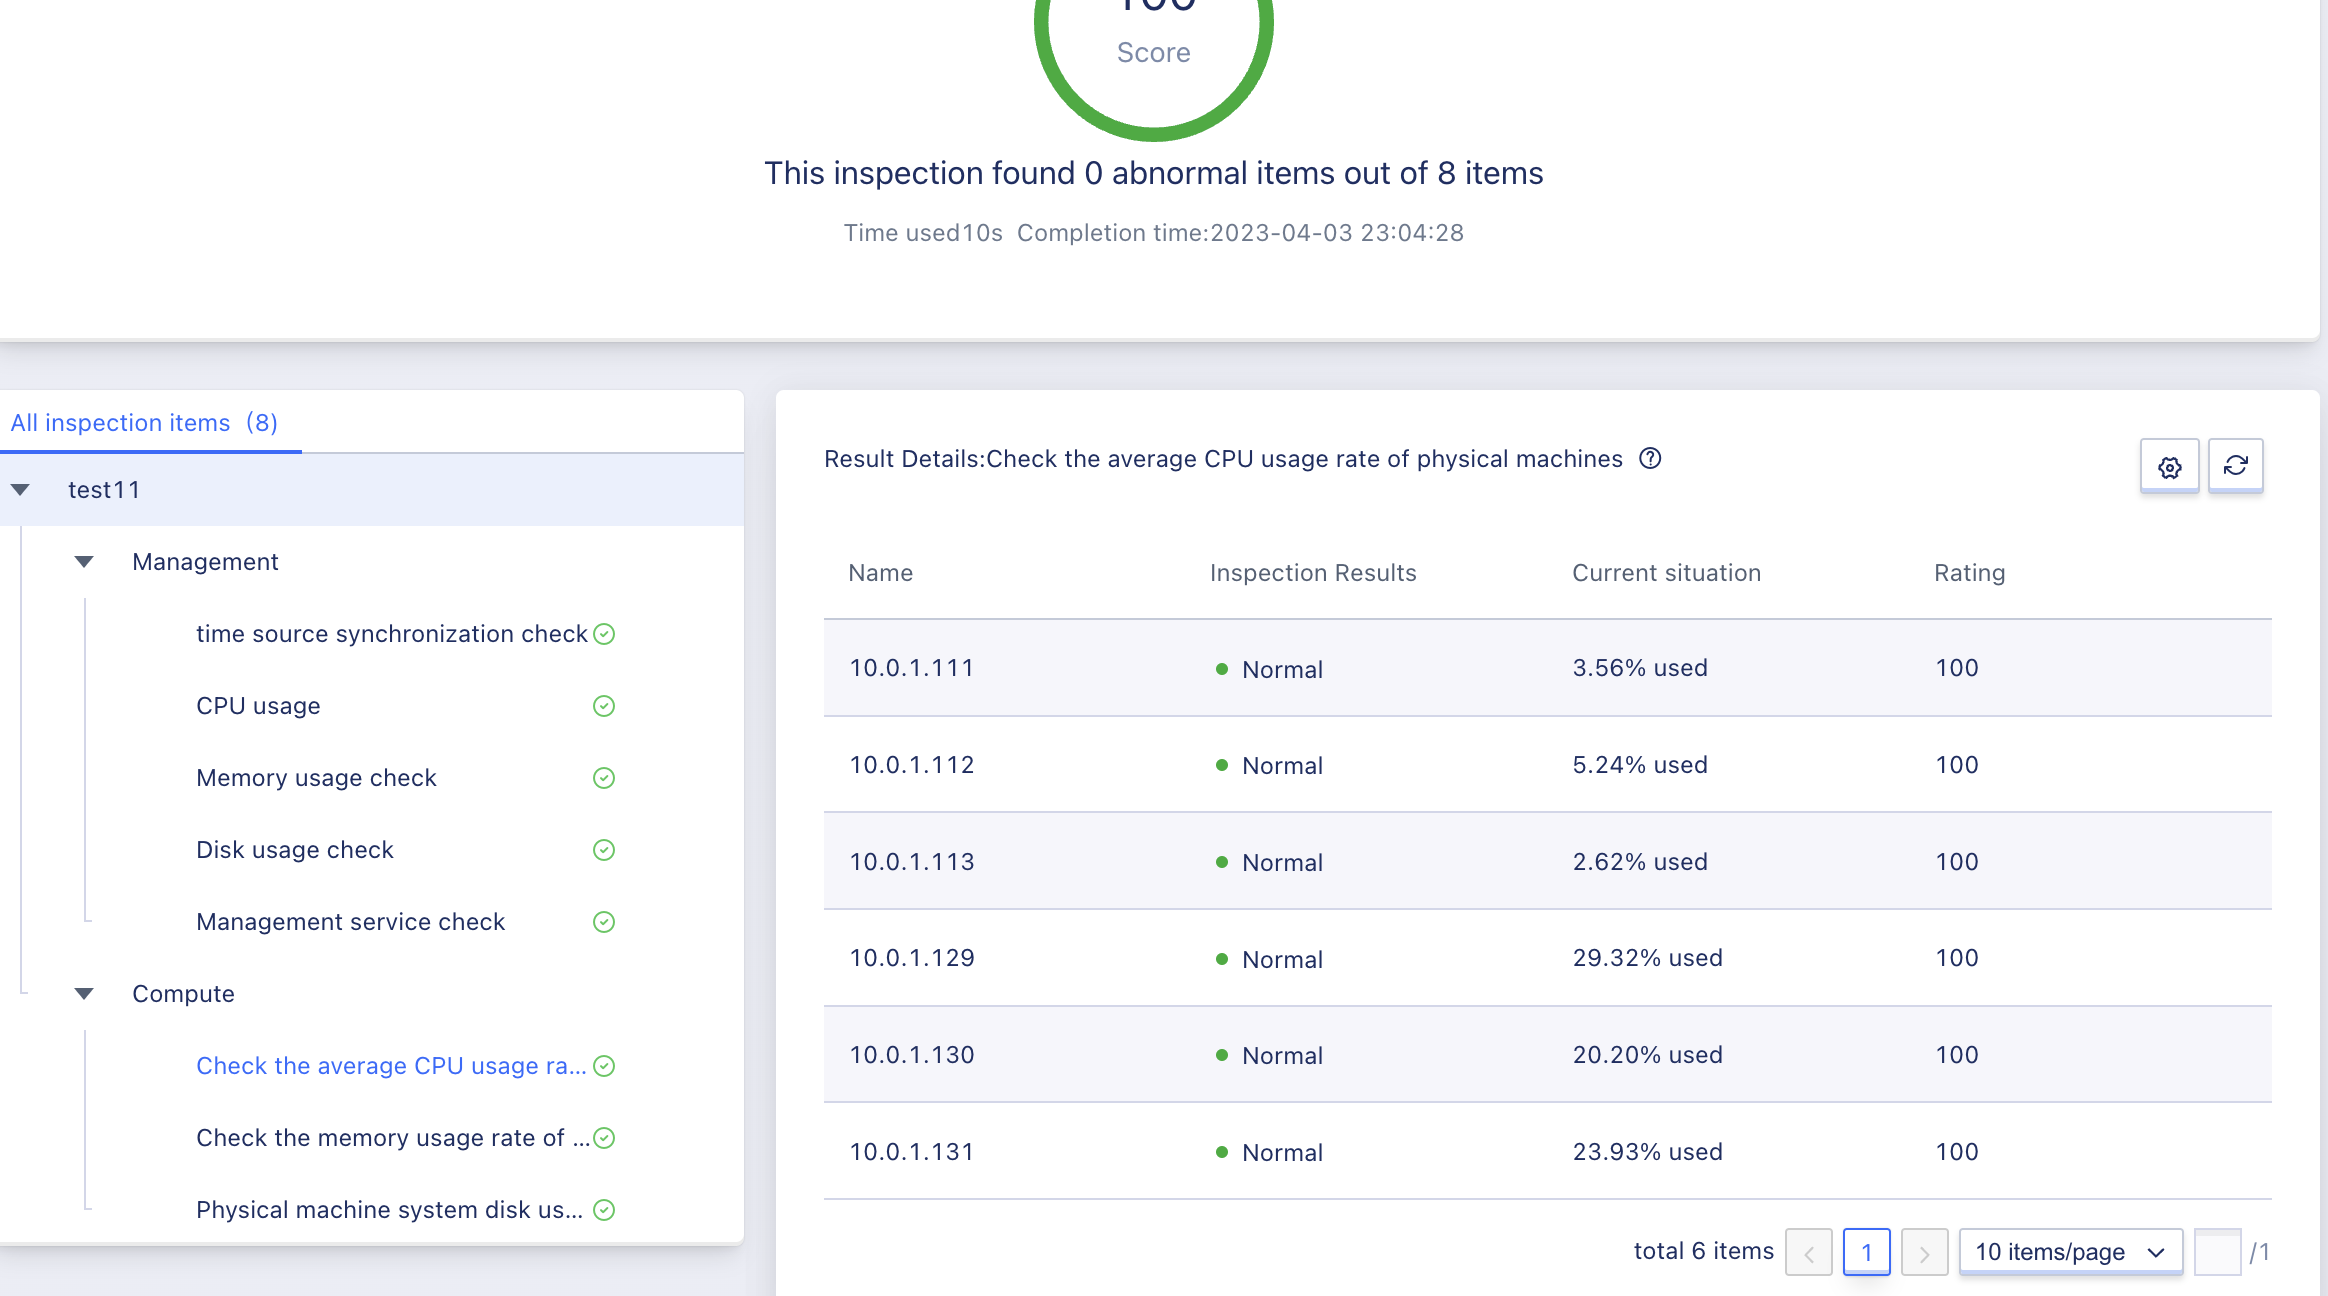
13.3.8 Physical Machine CPU Average Usage Rate Check
When the inspection result is normal, the average CPU usage rate of physical machines on the cloud platform should appear as shown in the figure below. When the inspection result is abnormal, the inspection result will be marked with a warning icon in the upper right corner with a question mark. Moving the mouse over the question mark will display the main file name, PID, and usage that caused the abnormal result.
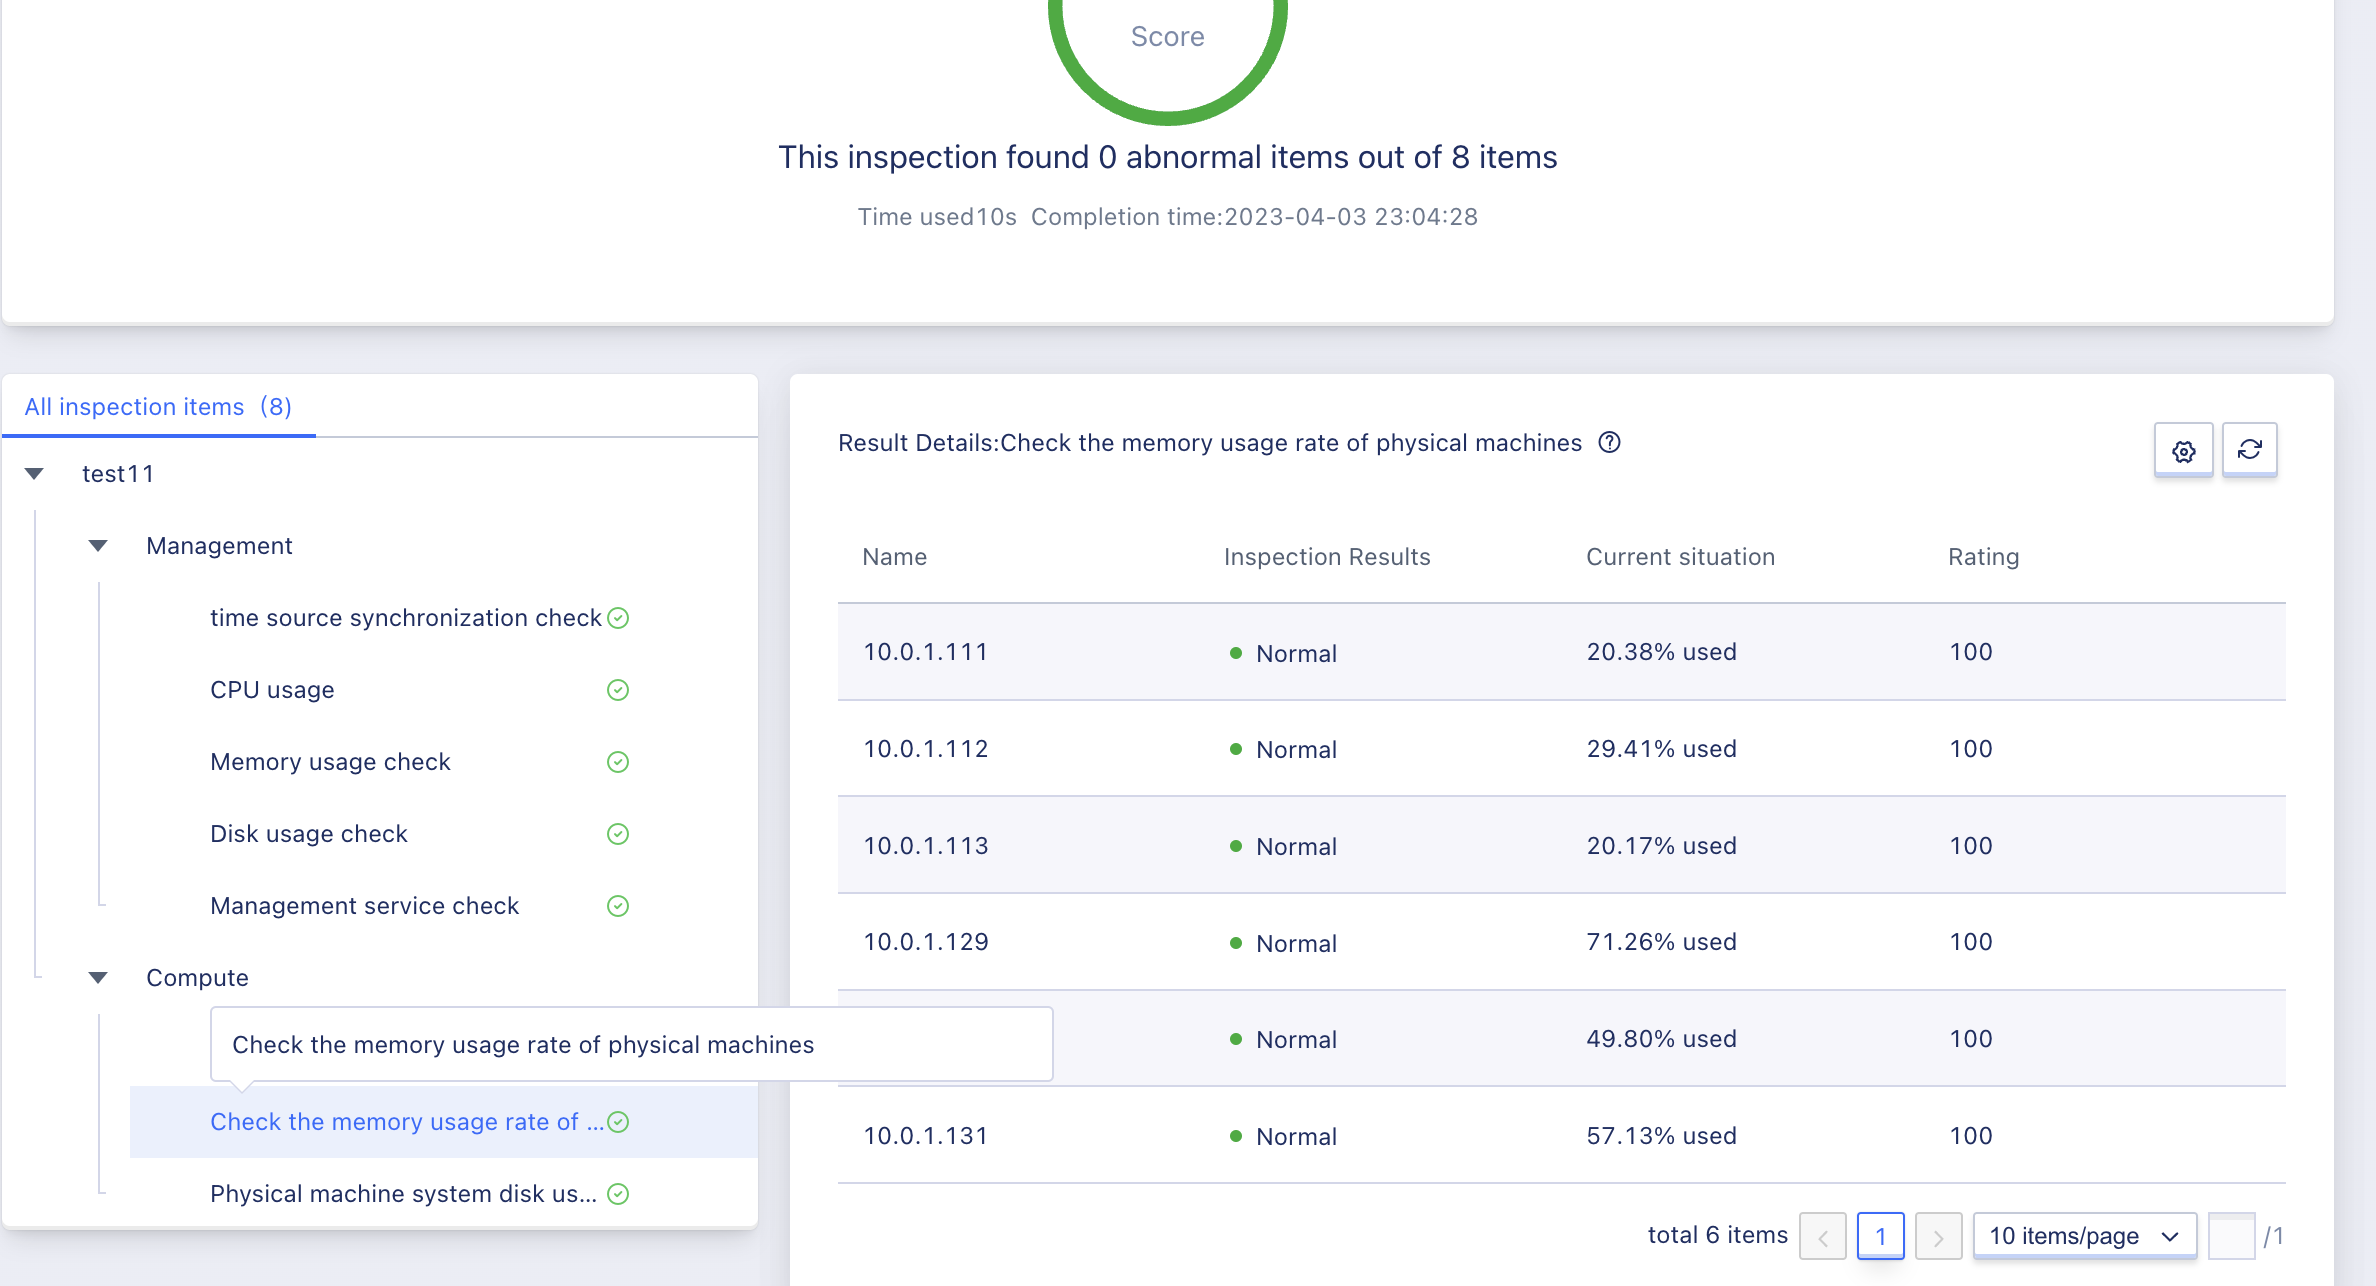
13.3.9 Check the Average Memory Usage Rate of Physical Machines
When the inspection result is normal, the average memory usage rate of physical machines on the cloud platform should appear as shown in the figure below. When the inspection result is abnormal, the inspection result will be marked with a warning icon in the upper right corner with a question mark. Moving the mouse over the question mark will display the main file name, PID, and usage that caused the abnormal result.
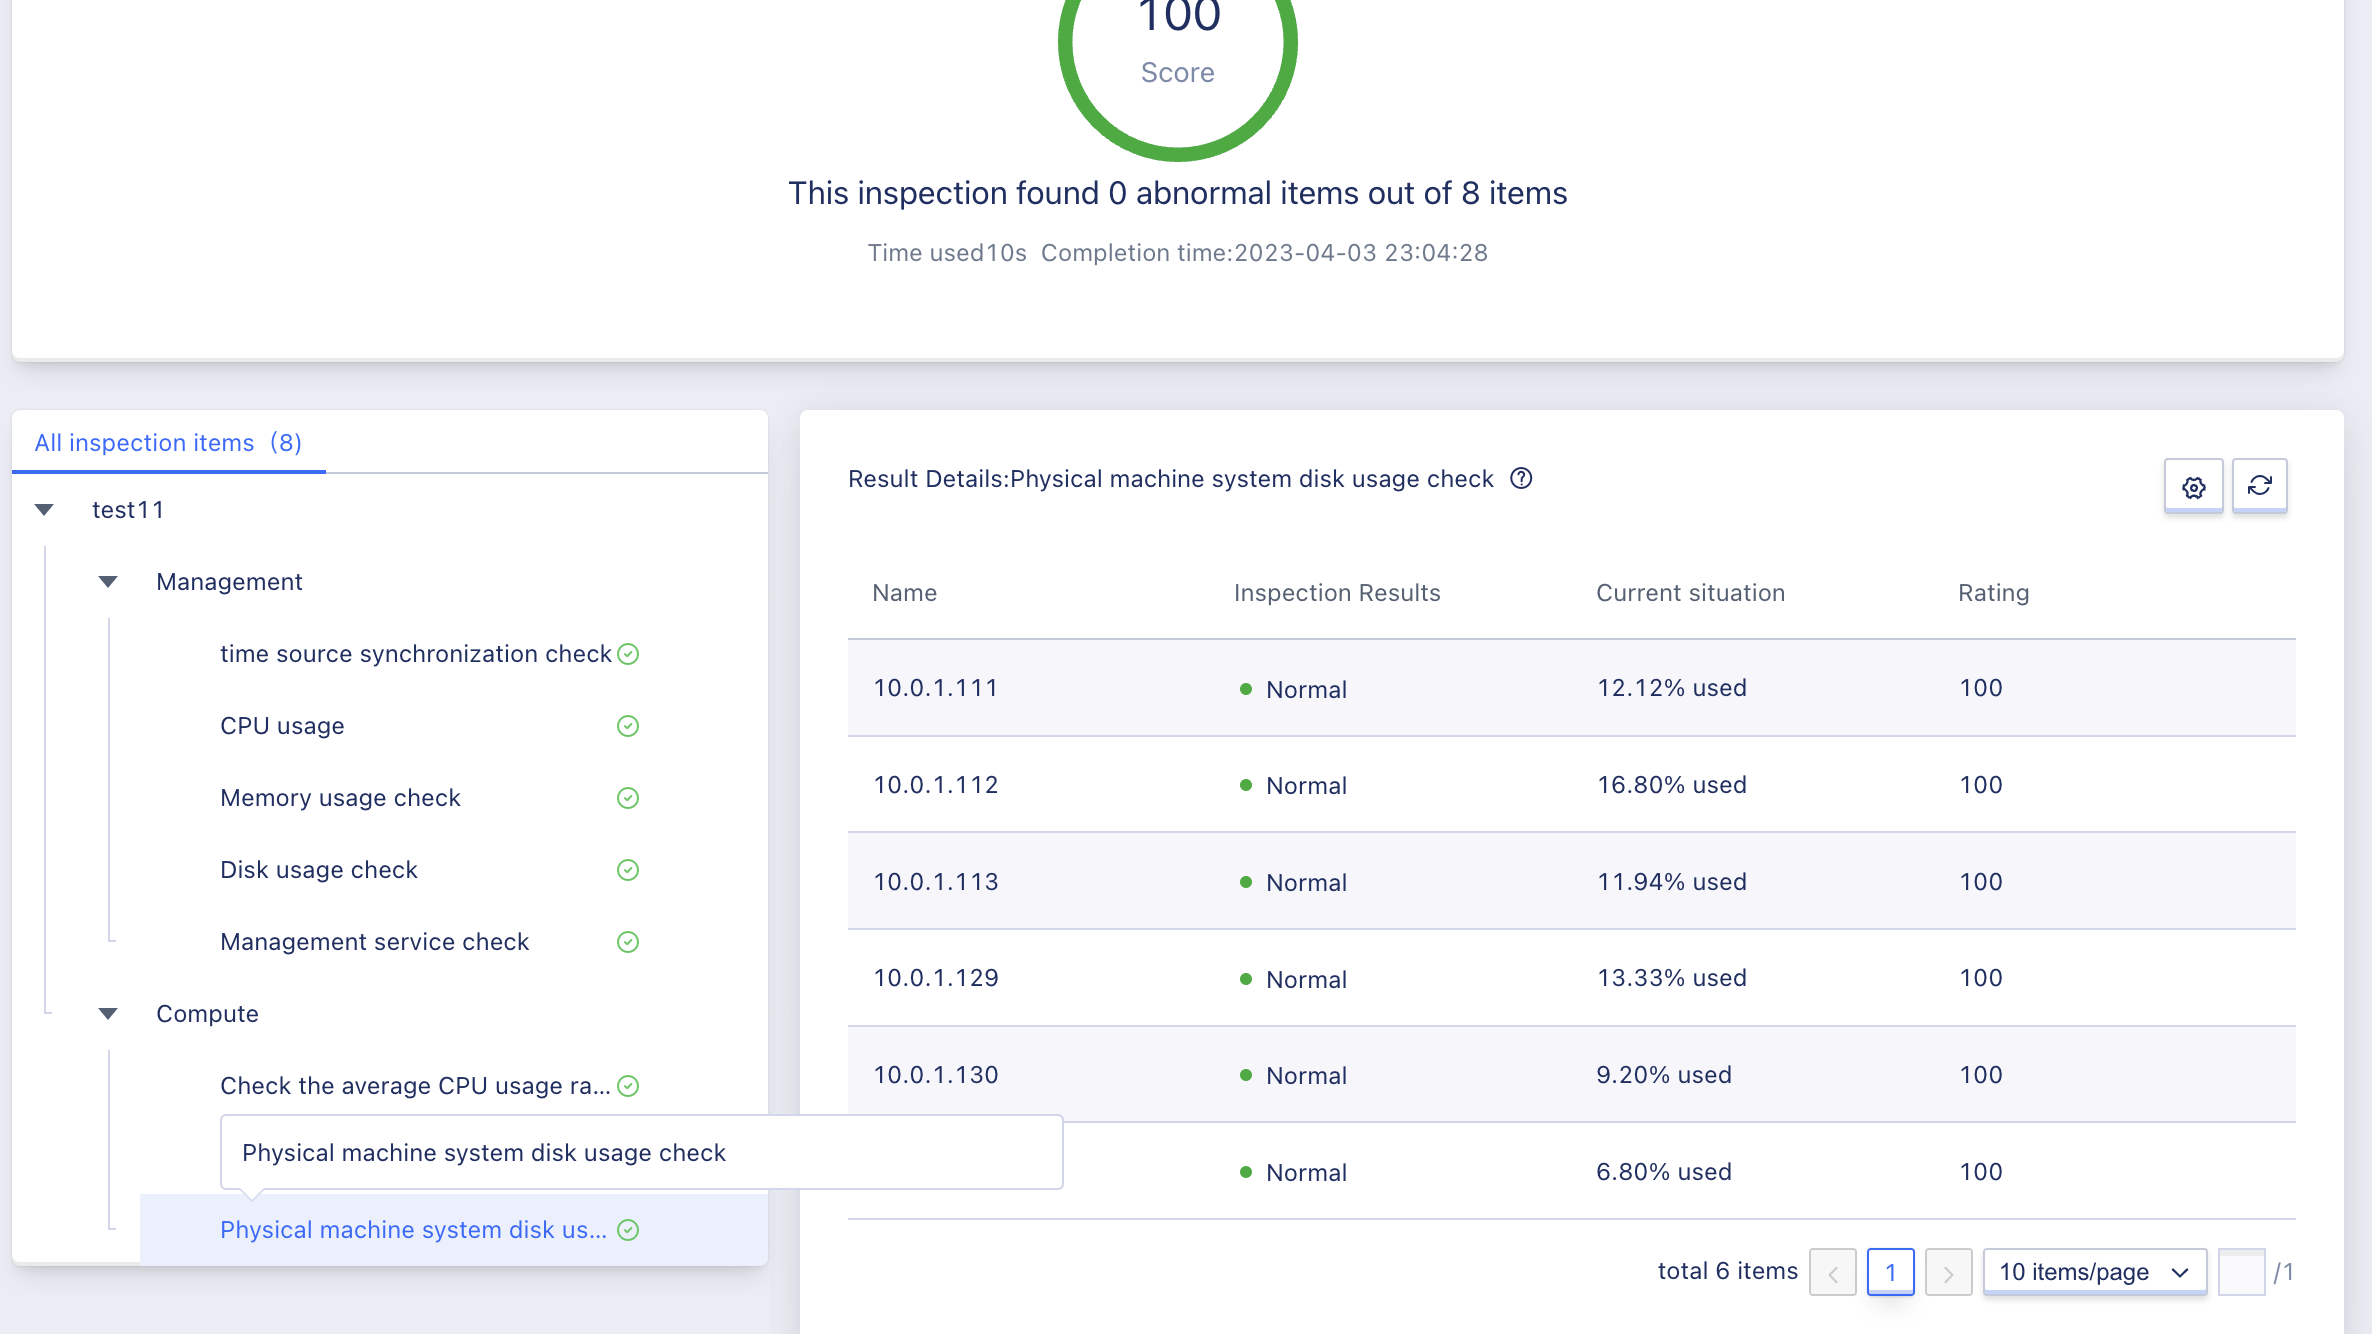
13.3.10 Check the Used Capacity of Physical Machine System Disk
When checking the usage and amount of the system disk of physical machines on the cloud platform, the inspection result should appear as shown in the figure below when it is normal. When the inspection result is abnormal, the inspection result will be marked with a warning icon in the upper right corner with a question mark. Moving the mouse over the question mark will display the main file name and size that caused the abnormal result.
13.4 Download Inspection Report
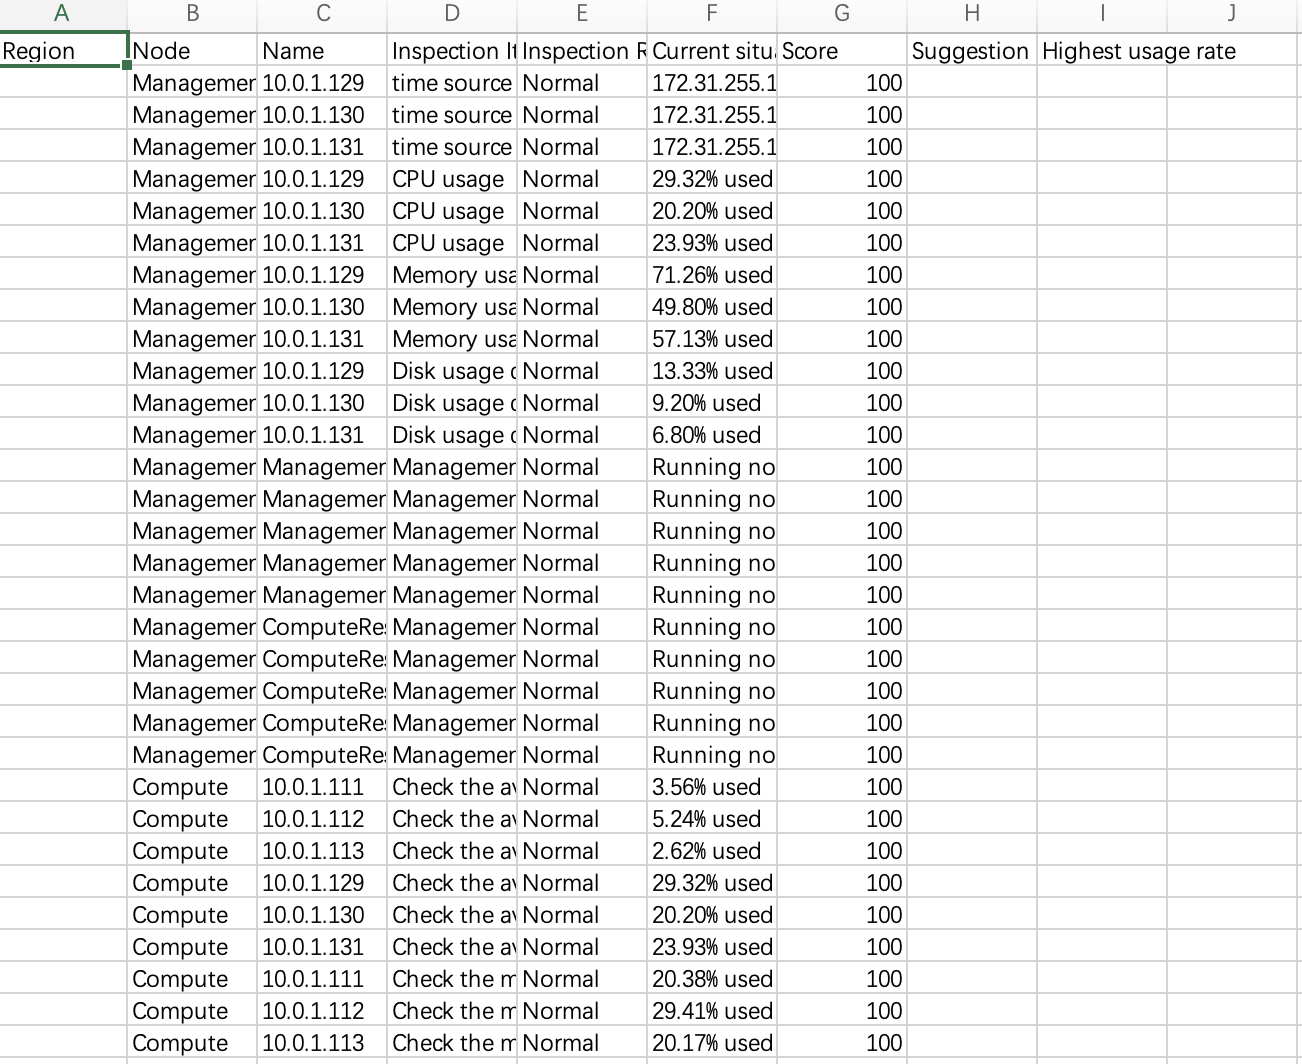
Users can download the inspection report and save it to their local device through the browser. After downloading the inspection report, users can view detailed information including location, node, name, inspection items, inspection results, status, score, suggestions, and highest usage rate. When the inspection result is abnormal, the status will display the current device parameters, suggestions will provide targeted recommendations, and the highest usage rate will display the main file name and size that caused the abnormal result, allowing management personnel to understand the status of physical machines in a timely manner.
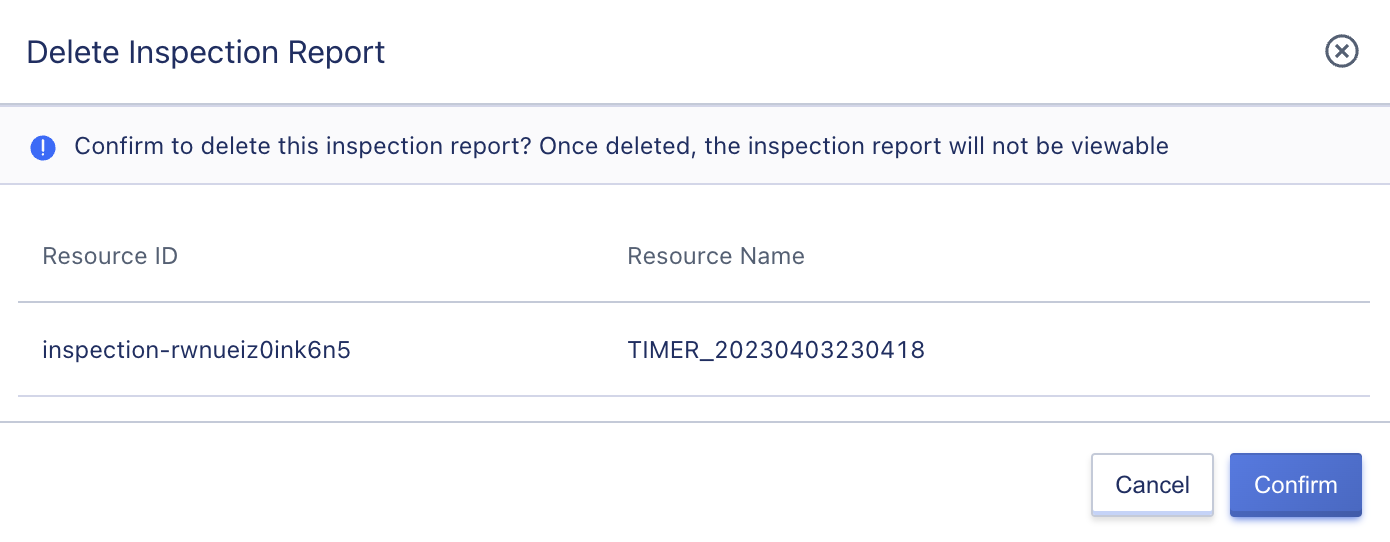
13.5 Delete Inspection Report
Users can delete inspection reports by using the inspection report list. Only completed inspection reports can be deleted.