12. Monitoring Dashboard
The monitoring dashboard is a cloud platform resource visualization dashboard provided by the platform for enterprises. It mainly displays monitoring data from a macro perspective of the platform, helping enterprise cloud platform operators to quickly understand the overall operation of the platform. It supports custom drag-and-drop modules and full-screen display, making it easy for administrators to manage split screens. Users can enter the monitoring dashboard page through the button on the left side of the administrator’s avatar, as shown in the figure below:
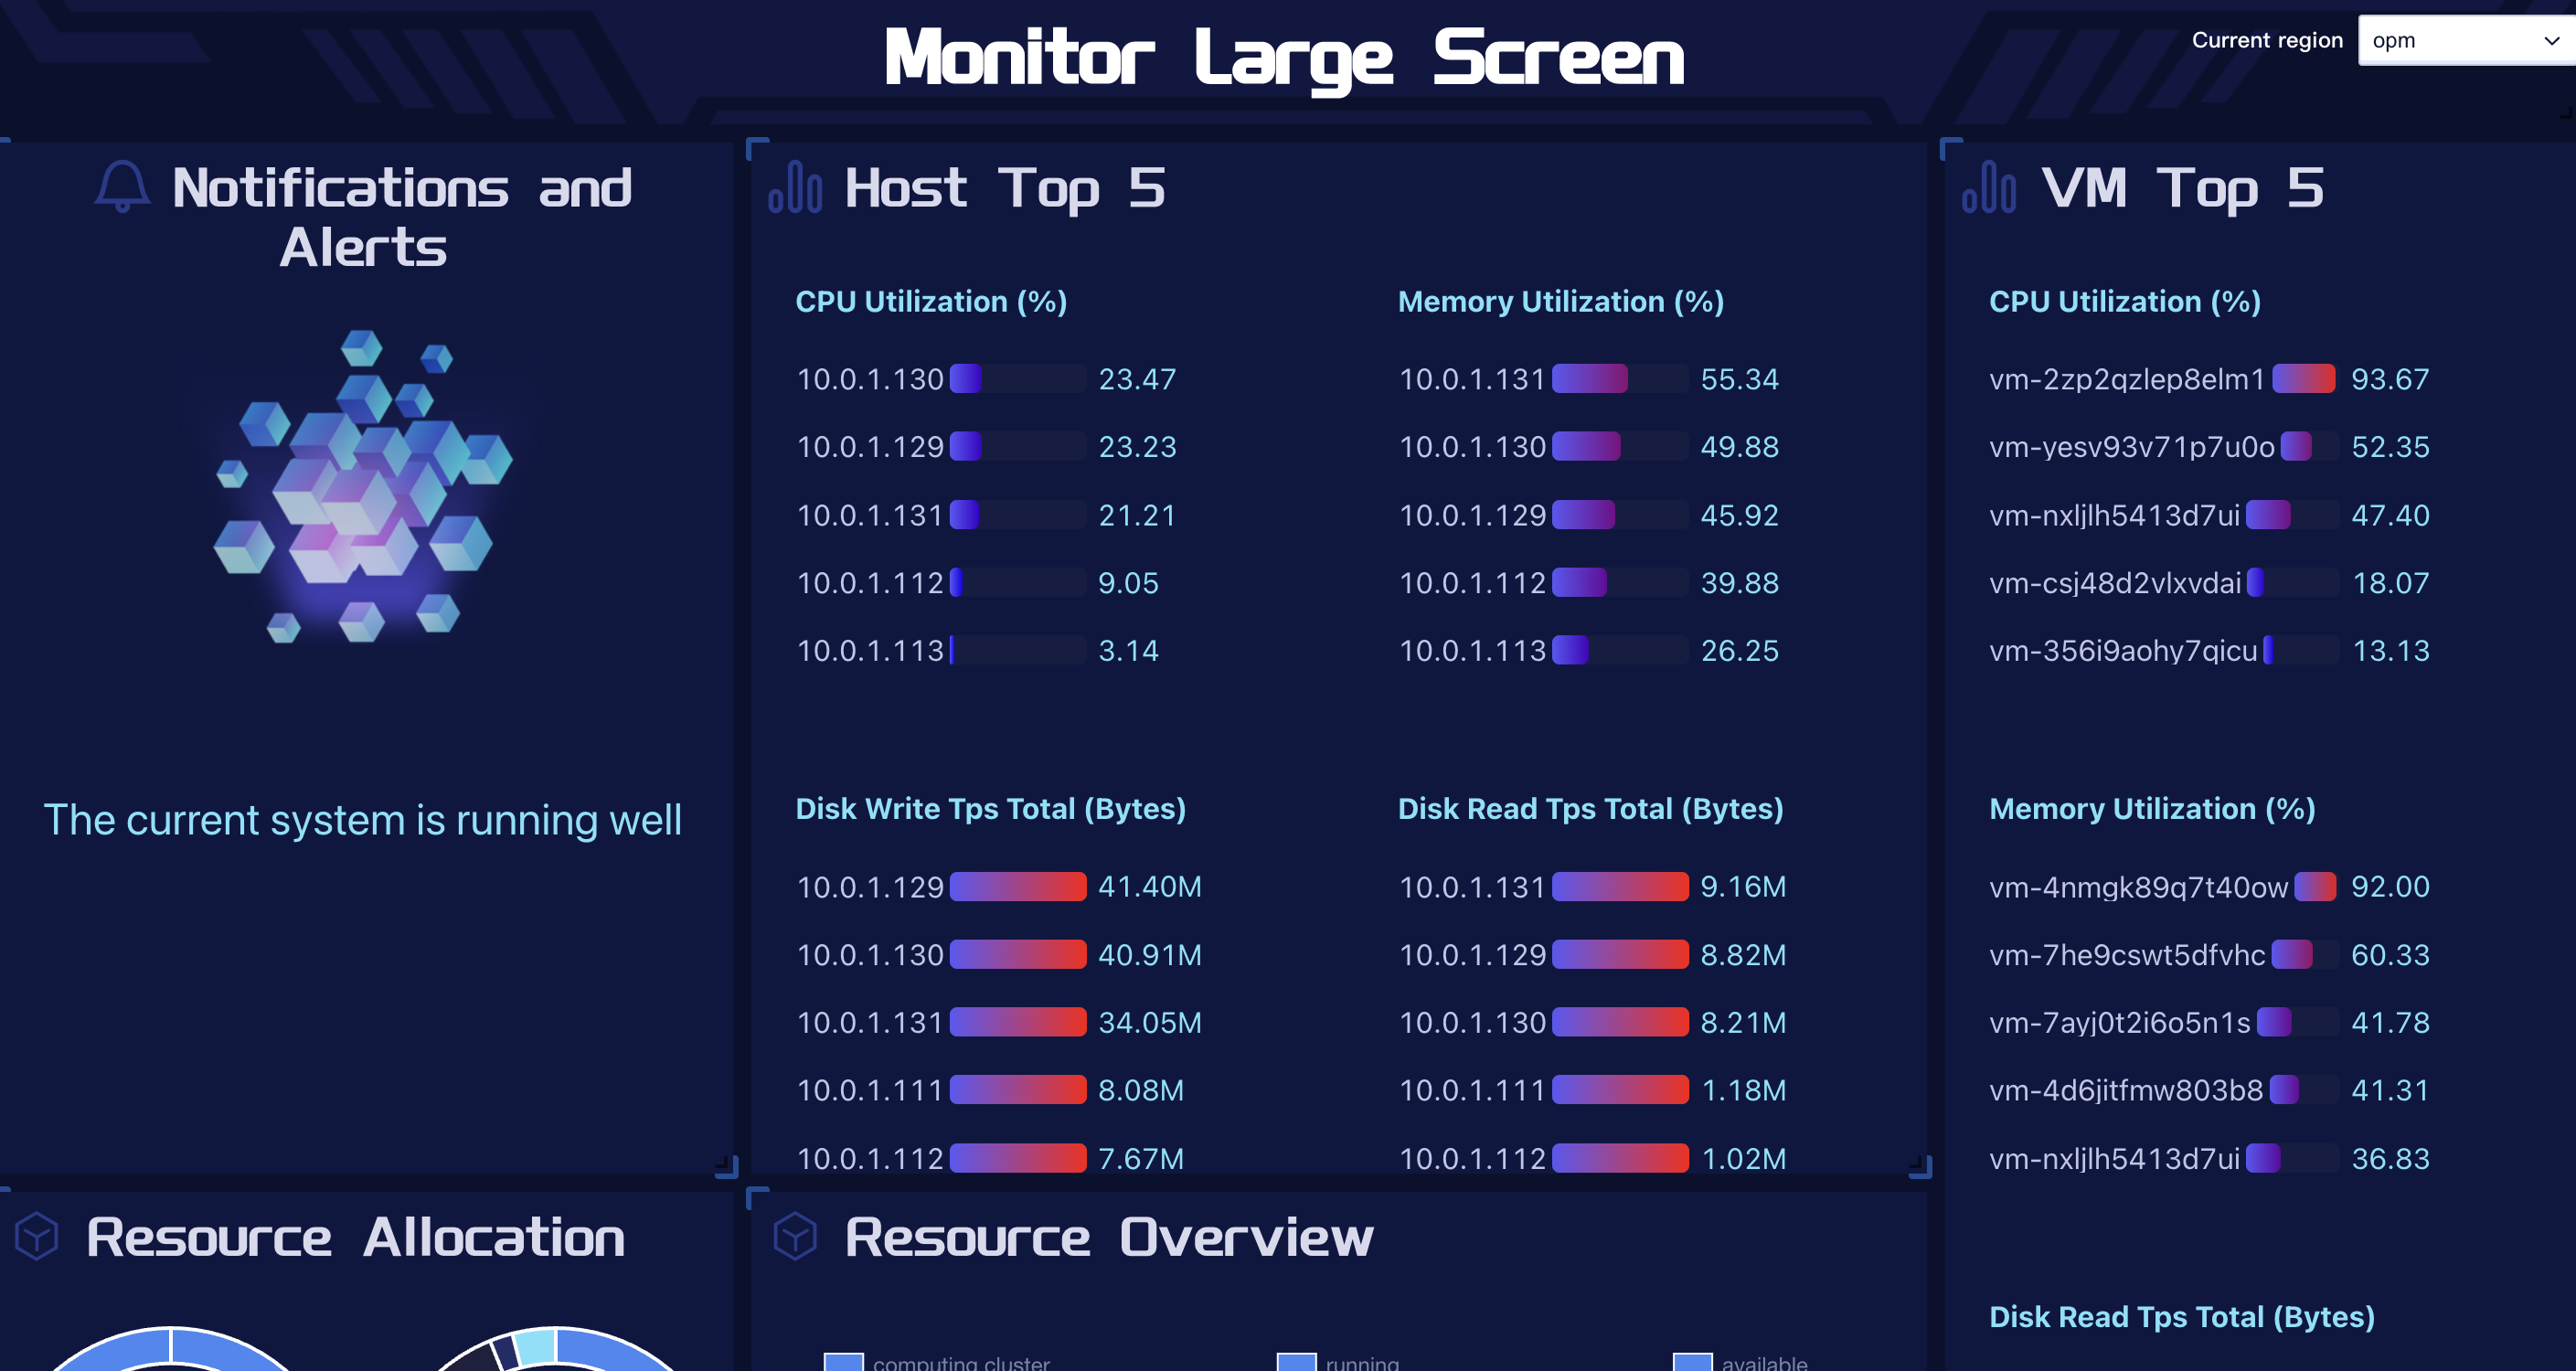
Notifications and alarms: Display the latest 5 platform alarm information.
Top 5 physical machines: Display the IP addresses of the top 5 physical nodes in terms of CPU usage, disk read throughput, disk write throughput, and memory usage.
Top 5 virtual machines: Display the IDs of the top 5 virtual machines in terms of CPU usage, disk read throughput, disk write throughput, and memory usage.
Top 5 bare-metal servers: Display the IDs of the top 5 bare-metal servers in terms of CPU usage and memory usage.
Resource allocation: Display the total capacity of CPU, memory, and storage on the cloud platform, as well as the percentage of allocated capacity.
Resource overview: Display the total number of physical machines and their state distribution (available, locked), as well as the number distribution of computing clusters and storage clusters, the total number of virtual machines, and their state distribution (operating, shut down, other).