19. Monitoring Alert
Monitoring and alarm is the operation and maintenance monitoring and alarm service of the private cloud platform’s full line of products, providing real-time monitoring data and chart information of all resources, and batch setting alarm strategies for resources according to monitoring data. When the resource fails or the monitoring index exceeds the alarm threshold, it will be notified and warned by email; at the same time, the monitoring and alarm service provides users with real-time resource alarm status, so that users can accurately control the health of business and various cloud products, and comprehensively guarantee the reliability and security of business.
The monitoring and alarm service provides four major framework functions: monitoring charts, alarm templates, notification groups and alarm records, all of which are based on monitoring data.
- The cloud platform intelligently collects data through a data collection system, allowing tenants to monitor complete data on specified monitoring indicators for virtual machines, cloud disks, EIPs, load balancers, NAT gateways, elastic scaling, VPN gateways, object storage, file storage and other resources; administrators can monitor complete data on specified monitoring indicators for nodes, computing clusters, and storage clusters.
- Store the collected monitoring data in the database, retrieve and count the data according to the specified rules, and display the monitoring charts in a graphical way according to the specified time dimension and data granularity.
- Based on existing monitoring data, users can configure alarm templates to specify alarm thresholds, duration, importance, notification groups, and comparison methods for specified monitoring indicators. By setting the alarm duration, different levels of alarms and notifications can be determined.
- Configure notification groups for alarm templates, specifying the notification personnel and notification methods when an alarm occurs.
- During the alarm period, real-time alarm information can be queried through alarm records to determine the occurrence time and importance of the fault.
19.1 Monitoring Charts
Monitoring charts indicate that the platform intelligently collects resource running data, retrieves and counts according to specified resources and indicators, and displays monitoring charts in a graphical way according to specified data granularity and time dimension. Through the monitoring chart, users can intuitively view and understand the performance, capacity and network status of the virtual resources running on the platform, and understand the health status and fault nodes of the resources in time.
The platform provides real-time and historical monitoring charts with various monitoring indicators for virtual machines, elastic EIPs, load balancers, NAT gateways, elastic scaling, VPN gateways, object storage, and file storage built for tenants, and alarm templates can be configured according to the monitoring indicators to give alarms and notifications when the threshold is exceeded.
- Virtual Machine Monitoring Chart: Through the monitoring information bar on the virtual machine details page, you can view the monitoring information of a single virtual machine, including network card out/in bandwidth, network card out/in packet volume, disk read/write throughput, disk read/write times, average load, space usage rate, memory usage rate, CPU usage rate, GPU usage rate, total GPU memory, GPU memory usage, total GPU consumption, average GPU power consumption, and GPU temperature.
- Elastic IP monitoring charts: Through the monitoring information on the EIP details page, you can view the monitoring information of a single EIP resource, including network card outbound bandwidth utilization rate, inbound bandwidth, outbound bandwidth, inbound packet volume, and outbound packet volume.
- Load Balancer Monitoring Chart: Through the monitoring information on the Load Balancer Details page, you can view the monitoring information of the Load Balancer instance and VServer listener separately. The monitoring chart includes LB connections per second, LB network card out/in traffic per second, LB network card out packet quantity, VServer connections, HTTP 2XX, HTTP 3XX, HTTP 4XX, and HTTP 5XX.
- NAT Gateway Monitoring Chart: Monitoring information of a single NAT gateway can be viewed through the NAT gateway details page, including NIC in bandwidth, NIC out bandwidth, connection number, NIC in packet volume, and NIC out packet volume.
- VPN Gateway Monitoring Chart: Through the VPN Gateway Service Details page, monitoring information for individual gateways can be viewed, including gateway out/in bandwidth, gateway out bandwidth utilization, and gateway out/in packet volume.
- VPN Tunnel Monitoring Chart: Monitoring information of a single tunnel can be viewed through the VPN Tunnel Service Details page, including tunnel out/in bandwidth, tunnel out/in packet volume, and tunnel health status.
- Object Storage Monitoring Chart: Monitor information can be viewed through the Object Storage Service Details page, including CPU usage, memory usage, number of objects, storage capacity, current storage, storage capacity usage, total storage write throughput, and total storage read throughput.
- File Storage Monitoring Chart: Monitor information can be viewed through the File Storage Details page, including CPU usage, memory usage, storage capacity, current storage, storage capacity usage, total storage write throughput, and total storage read throughput.
The platform provides real-time monitoring charts with various monitoring indicators for administrators’ nodes, computing clusters, and storage clusters, and can configure alarm templates according to user requirements to give alarms and notifications when the threshold is exceeded.
- Node monitoring chart: Monitor information can be viewed through the node details page, including CPU usage, memory usage, and GPU usage.
- Calculate cluster monitoring charts: Monitor information can be viewed through the cluster details page, including CPU allocation rate, memory allocation rate, and GPU allocation rate.
- Store cluster monitoring charts: Viewable through the storage cluster details page monitoring information, including storage allocation rate.
Monitoring charts can display real-time monitoring data according to the time dimension, and also support viewing monitoring data and chart information for 1 hour and custom time.
19.2 Alarm Template
Alarm templates are a batch setting function of resource alarms provided by the private cloud platform monitoring alarm service for users. By pre-defining the alarm rules and notification rules in the template, the rules defined in the template are applied to the virtual resources; if the monitoring index data of the virtual resource reaches or exceeds the threshold and conditions set in the alarm rule, an alarm notification is sent to the designated contact according to the notification method defined in the notification rule.
According to different resource types, customized alarm rules with different monitoring indicators and thresholds can be set, and the monitoring indicators can be applied to a single network card or disk device associated with the resource to meet the monitoring and alarm requirements in various application scenarios.
- Alarm templates are composed of multiple alarm rules and associated resources.
- A single alert template only supports binding one type of resource, including virtual machines, public network elastic IPs, NAT gateways, load balancers, and VPN gateways.
- Each alert template can contain multiple alert rules, each alert rule contains monitoring indicators, comparison methods, alert thresholds, duration, importance and notification groups.
- Each alarm template only supports binding one notification group, each notification group can contain multiple notifiers, and supports email notification.
19.2.1 Create Alert Template
Users can quickly create an alarm template by specifying the resource type, template name, and remarks. In the alarm rule management, create the alarm rule that is suitable for the business needs. Finally, associate the alarm template to the virtual resource to complete the monitoring and alarm configuration. Users can enter the monitoring and alarm configuration console through the “Monitoring and Alarm” navigation bar in the console, and enter the alarm template creation wizard page through the “Create” button on the “Alarm Template” page, as shown in the following figure:
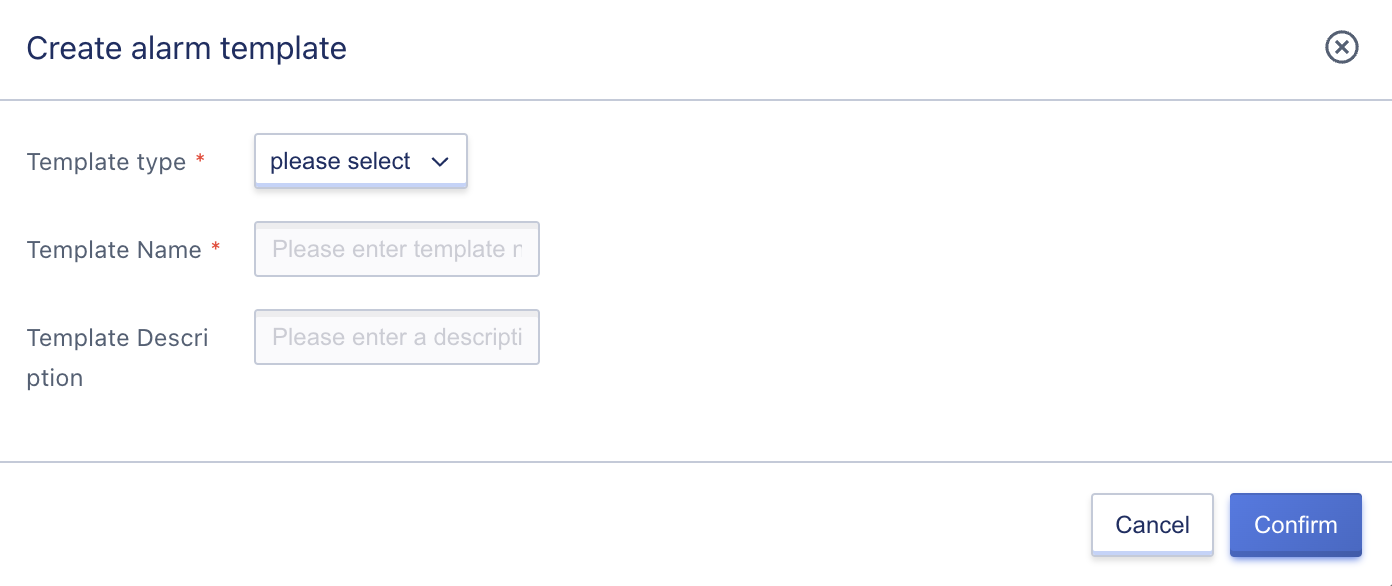
- Template type: The type of resource that the alarm template needs to be bound to, including virtual machines, public network elastic IPs, NAT gateways, load balancers, object storage, file storage, and VPN gateways. One alarm template only supports one type of resource.
- Template Name/Description: Name identifier and globally unique identifier for the alert template.
After clicking confirm, the wizard page will return to the alarm template list, and you can view the created resource list and information through the alarm template list.
19.2.2 View Alarm Template
Users can enter the alarm template resource console through the navigation bar to view the resource list of alarm templates, and can also click the name of the alarm template on the list to enter the template details page to view the detailed information of the alarm template, alarm rule management and binding resource management.
19.2.2.1 Alarm Template List
The alarm template list page can view the list of templates owned by the current account, including name, ID, resource type, number of bound resources, and operation items, as shown in the following figure:
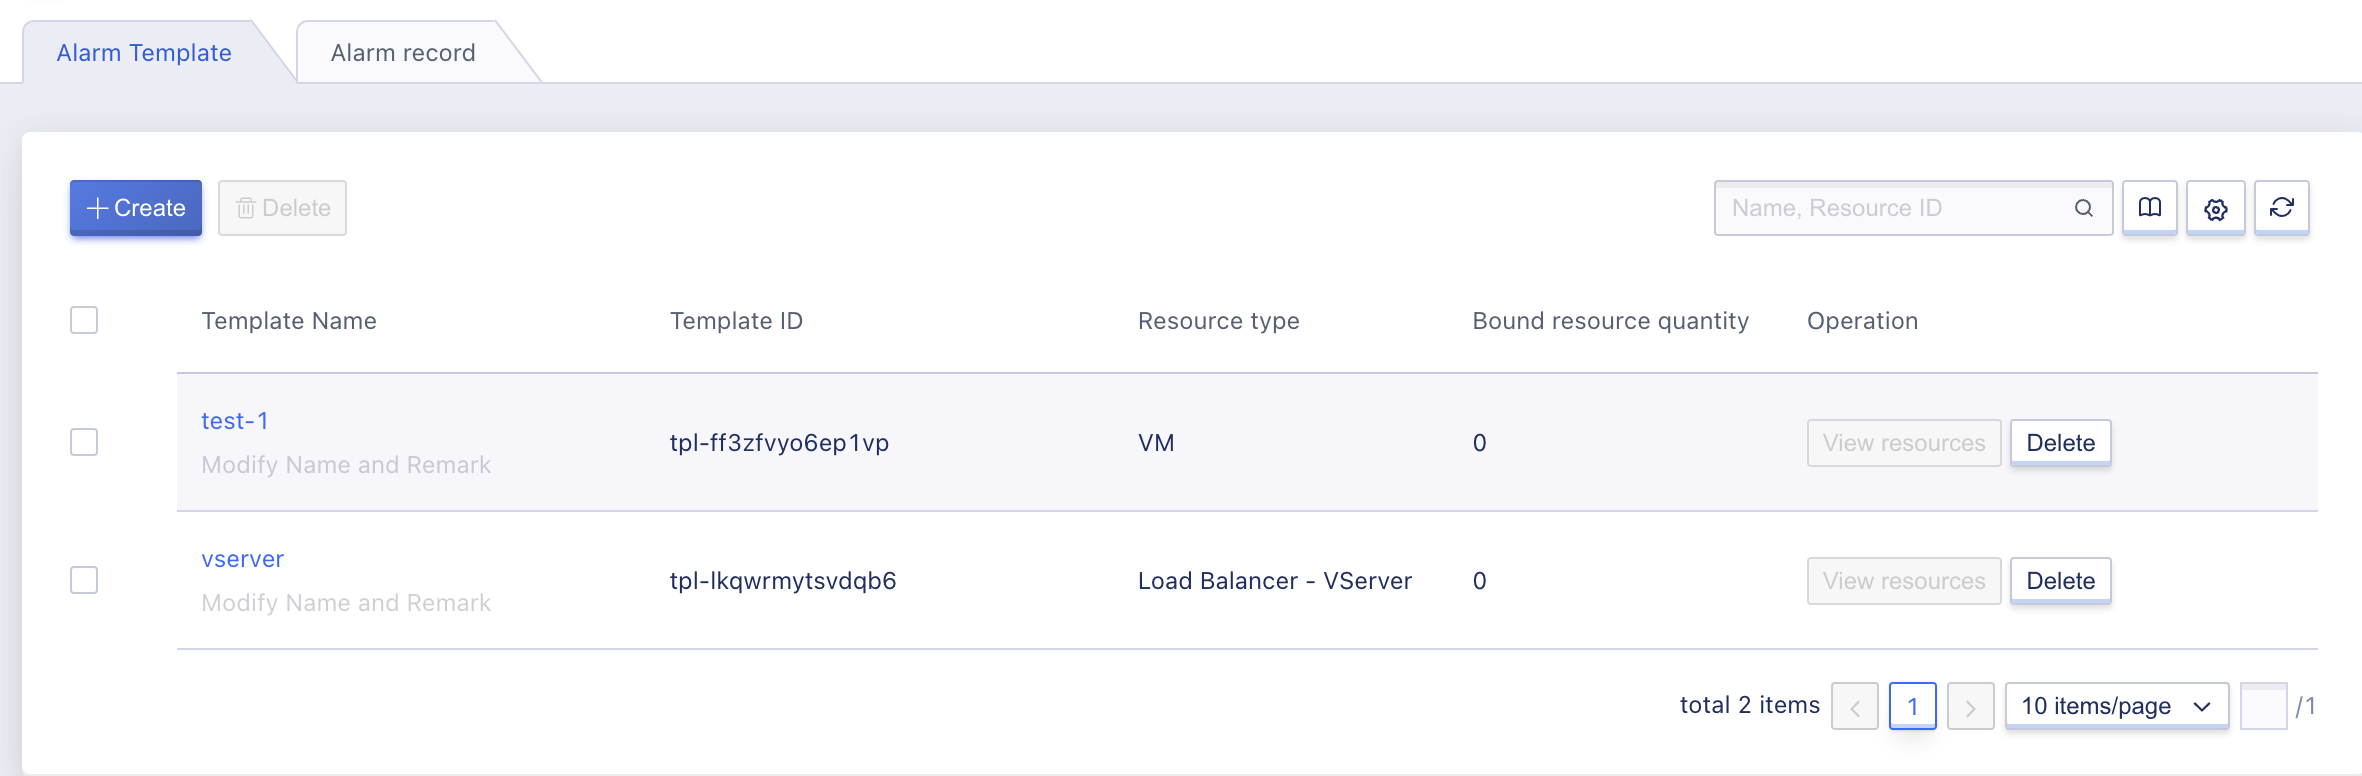
- Name/ID: The name and globally unique identifier of the current alarm template.
- Resource type: The resource type specified when the current alarm template is created.
- Number of bound resources: the number of resources currently associated with the alarm template.
- Operation: Operation items for single alarm template, including details, view resources and delete.
- You can search and filter the resource list through the search box, supporting fuzzy search.
19.2.2.2 Alarm Template Details
Enter the template details page through the “Name” of the alarm template list, you can view the details of the current alarm template, as shown in the figure below, the details page is divided into basic information, alarm rule management and resource binding management:
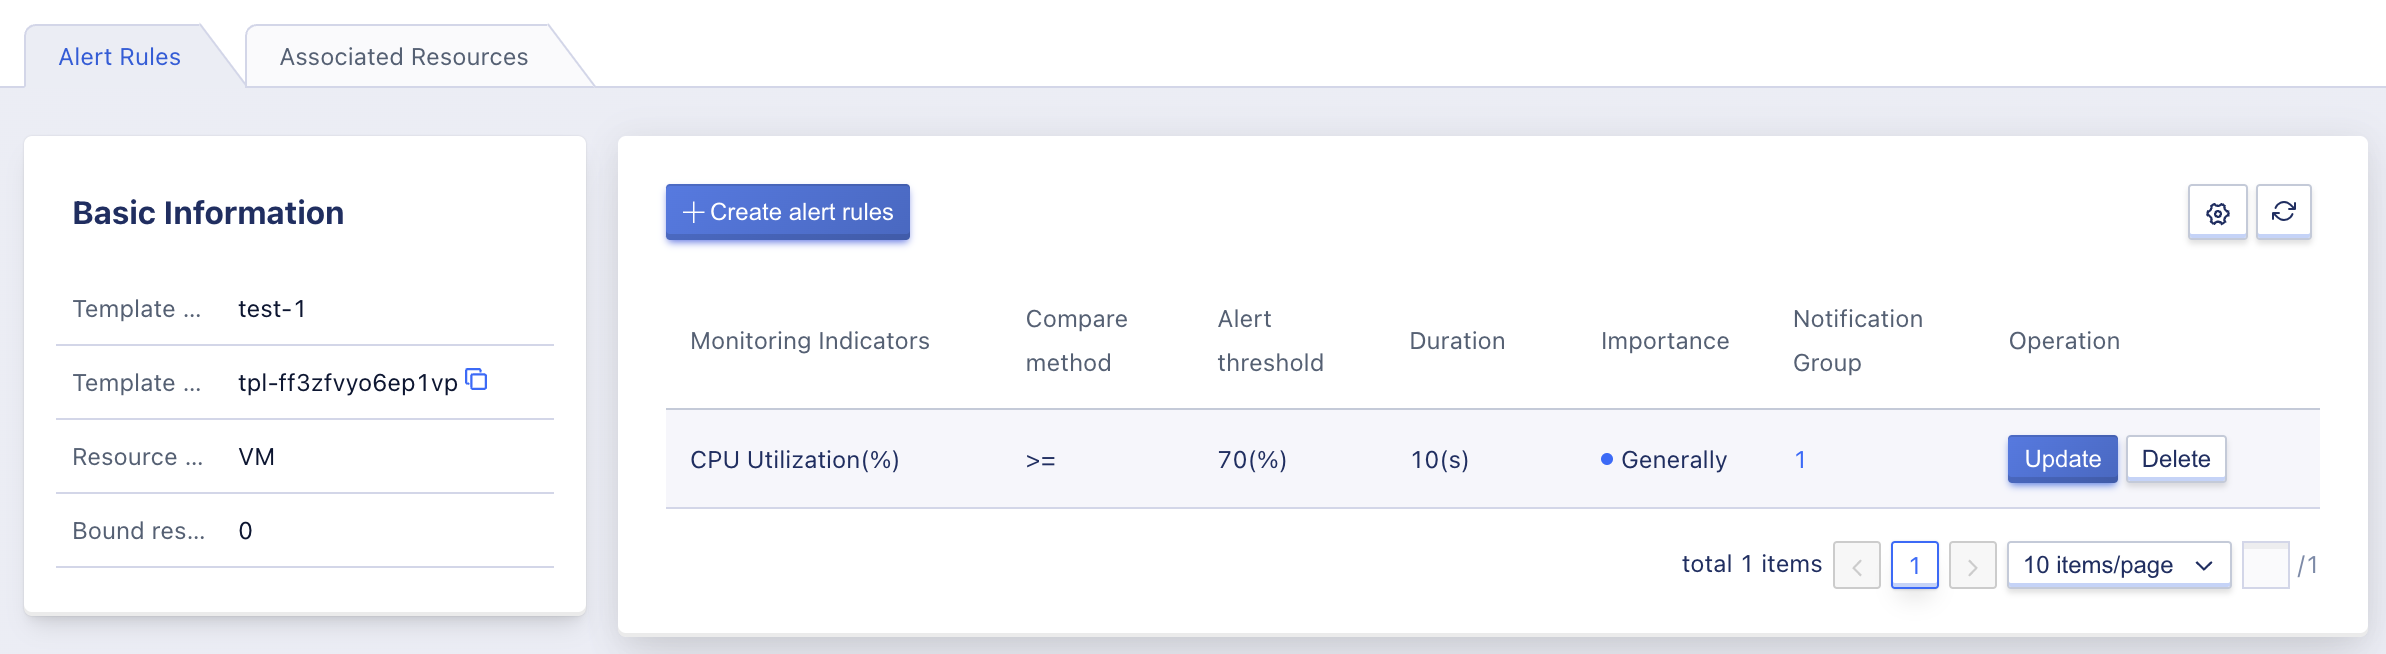
- Basic information: The basic information of the current alarm template, including name, ID, resource type, number of bound resources, etc. If the number of bound resources is empty, it will be displayed as “0”.
- Alarm rule management: The alarm rule management of the current alarm template, including the creation, viewing, updating, and deleting of alarm rules, for specific management operations, see Alarm Rule Management.
- Resource Binding Management: Management of resources currently associated with alarm templates, i.e. resources on which the rules in the alarm template can take effect, including binding resources, viewing already bound resources, and unbinding resources. For specific management operations, see Binding Resource Management.
19.2.3 View Resources
Checking resources refers to viewing the information of the resources that the current alarm template is bound to. Clicking on it will take you to Binding Resource Management.
19.2.4 Delete alarm template
You can only delete an alarm template if it is not bound to any resources. The successfully deleted alarm template will be destroyed directly. Users can delete the template through the “Delete” in the monitoring alarm template resource control console, as shown in the following figure:
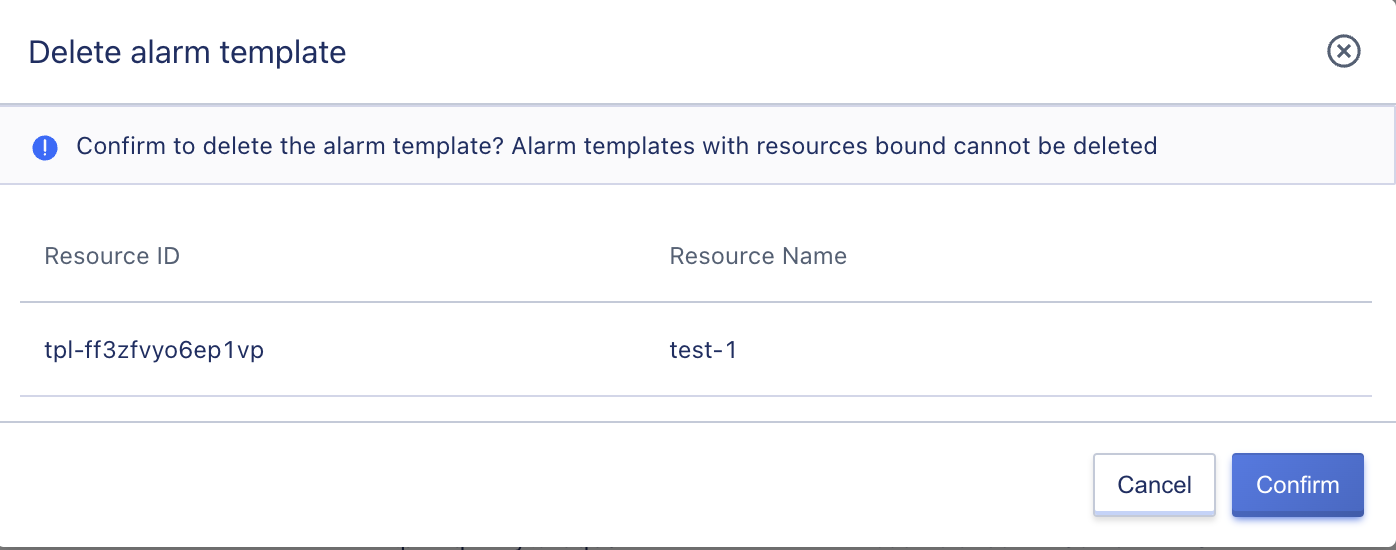
After the deletion of the alarm template is confirmed, the system will automatically return to the alarm template list page, where you can view the deletion process. The deletion is successful when the resource is emptied.
19.2.5 Alarm Rule Management
Alarm rules are the core of alarm templates, each alarm template is composed of one or more alarm rules. The resource monitoring metrics bound to the alarm template will trigger the relevant alarm policy according to the threshold defined in the alarm rule, and notify the alarm information through the notification method in the alarm rule, so as to quickly handle the alarm or fault.
19.2.5.1 Create Rules
Users can create alarm rules through the “Create” function on the alarm template details page. When creating an alarm rule, you need to specify the monitoring index, comparison method, alarm threshold, duration, severity, and notification group parameters, as shown in the figure:
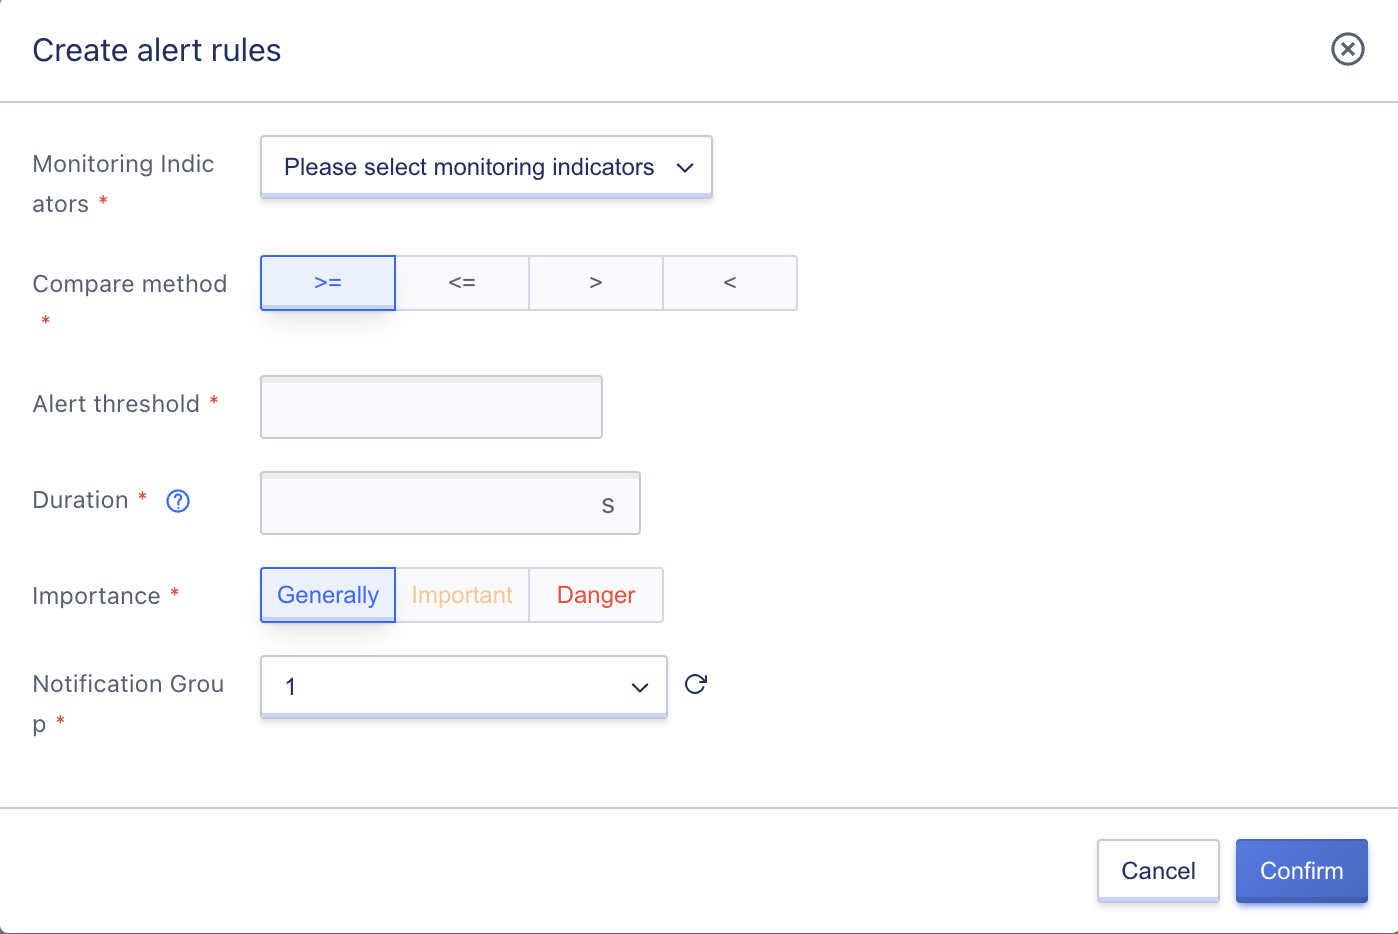
- Monitoring Indicators: Only monitoring indicators included in the alarm template resource type can be selected, and one alarm rule only supports one monitoring indicator.
- Comparison method: refers to the comparison method of the actual data of the monitoring indicators and the alarm threshold, which represents the alarm logic of the current alarm rule, including
>=,<=,>,<:- When selecting
>=, it means that an alarm cycle is triggered when the monitoring data is greater than or equal to the threshold. - When selecting
<=, it means that an alarm cycle will be triggered when the monitored data is less than or equal to the threshold. - When selecting
>, it means that an alarm cycle will be triggered when the monitoring data is greater than the threshold. - When selecting
<, it means that an alarm cycle is triggered when the monitored data is less than the threshold.
- When selecting
- Alarm threshold: refers to the critical value of the monitoring index data, compared with the monitoring index data, in accordance with the comparison method, a alarm cycle is triggered, such as the alarm threshold of CPU usage rate is 80, the comparison method is greater than or equal to, that is, when the CPU usage rate is greater than or equal to 80%, an alarm cycle is triggered.
- Duration: The duration of the threshold being triggered for monitoring metric data, an alarm will be triggered only if the threshold is reached within the duration.
- Importance level: Users can select an appropriate level according to business needs when creating an alarm rule, which is divided into general, important, and dangerous. The importance level can be used to filter the alarm records in the alarm record.
- Notification Group: When the alarm cycle is triggered and notification needs to be sent, the way to send alarm notification and the contact person.
After selecting and configuring, click “Confirm” to return to the alarm template details page, and view the created alarm rules through the alarm rule list.
19.2.5.2 View the rules
You can view the list of rules included in the current template through the alarm template details page. The list information includes monitoring metrics, comparison methods, alarm thresholds, duration, importance, notification groups and operations, as shown in the following figure:
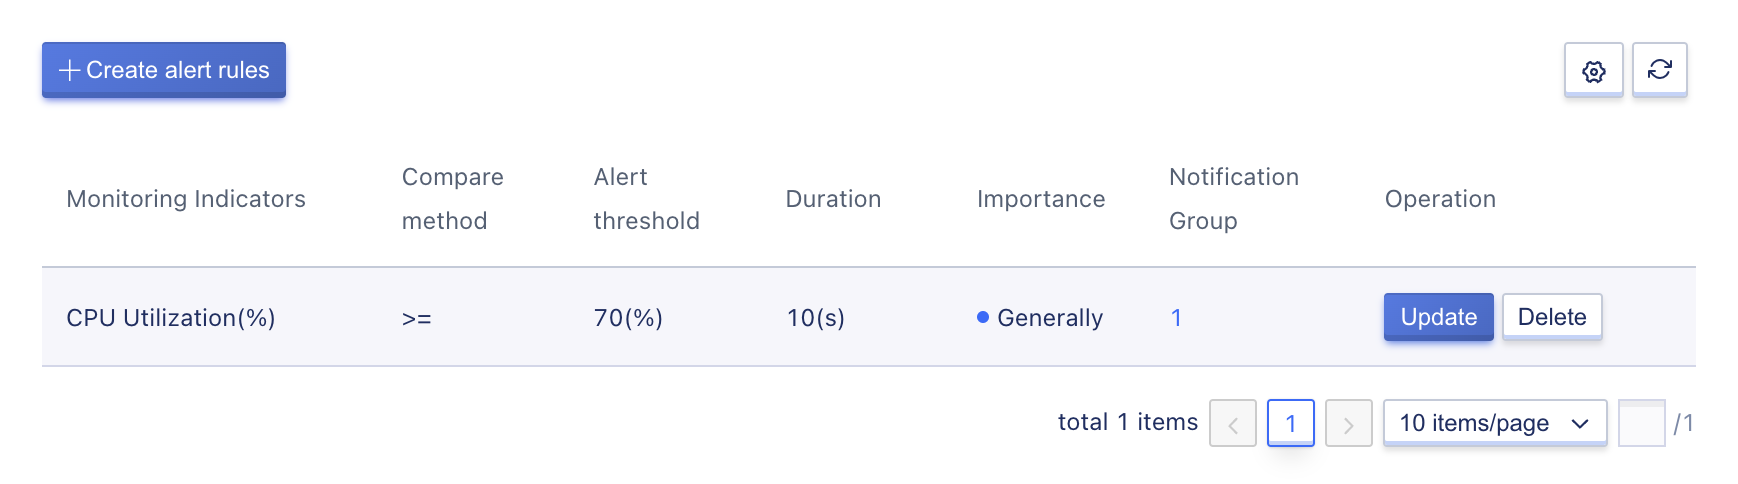
The operation item refers to the operation of a single notification rule, including update and delete, which respectively refer to the modification and deletion of a single alarm rule.
19.2.5.3 Update rules
Updating rules refers to the modification of a single alarm rule. The selection and configuration of the modification items are the same as those of creating an alarm rule, which can be referred to Creating Rules.
19.2.5.4 Delete Rule
Delete alarm rule refers to the deletion of a single alarm rule. After the rule is deleted, it is directly destroyed and the alarm rule of the monitoring index can be added again.
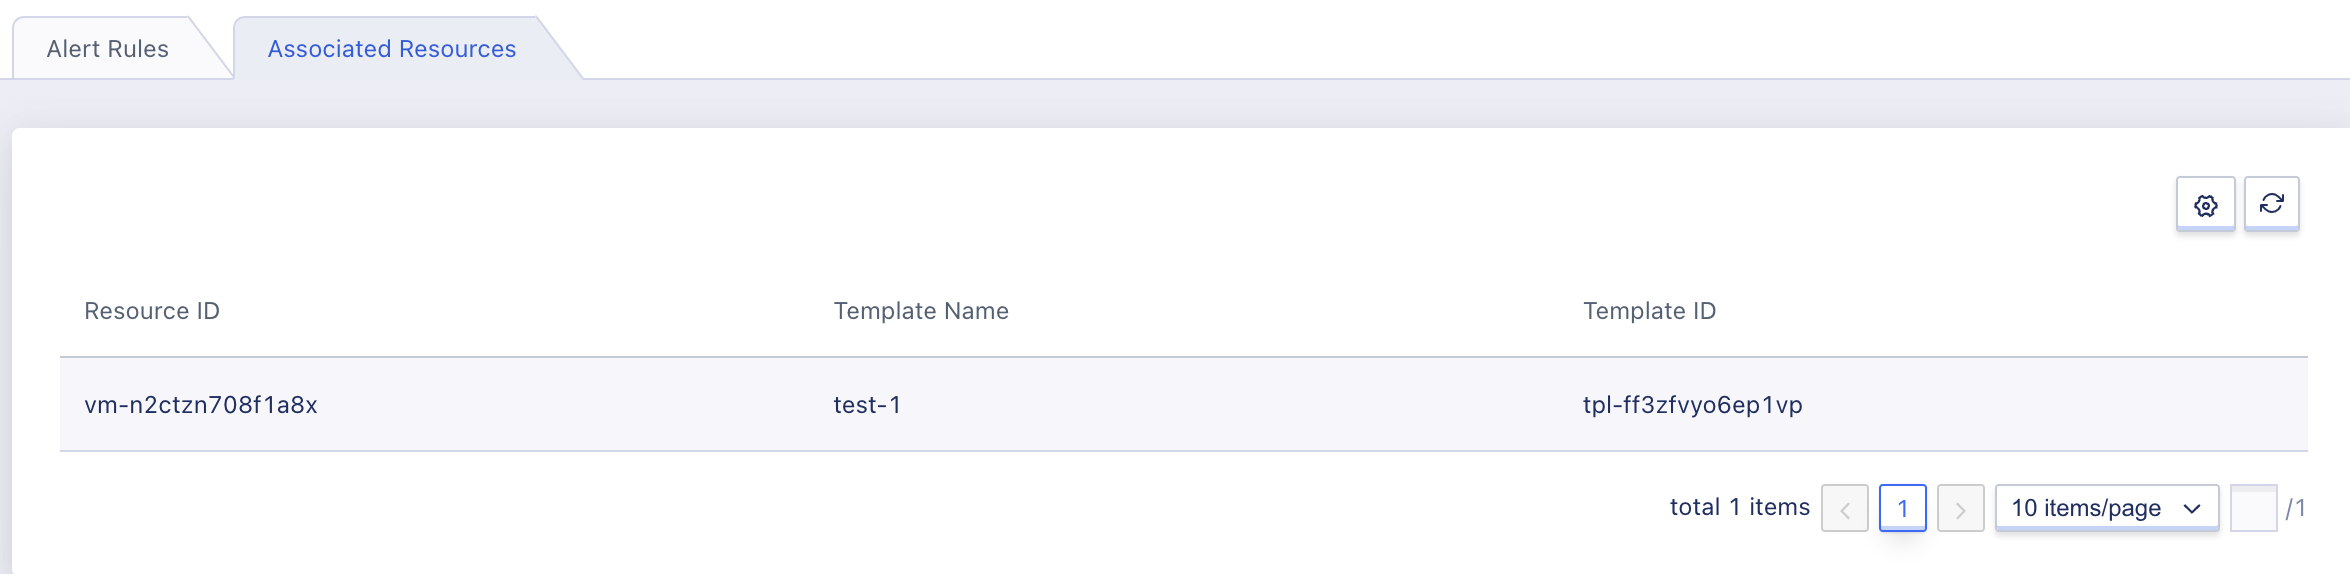
19.2.6 View Bound Resources
Through the resource tags of the alarm template details, enter the alarm template resource binding management page, you can view the list and information of the bound resources, including the ID of the bound resource, template name, and template ID, as shown in the following figure:
19.3 Alarm Record
The alarm record refers to all alarm records and information of the current account, and through the alarm record, the real-time historical alarm information is obtained.
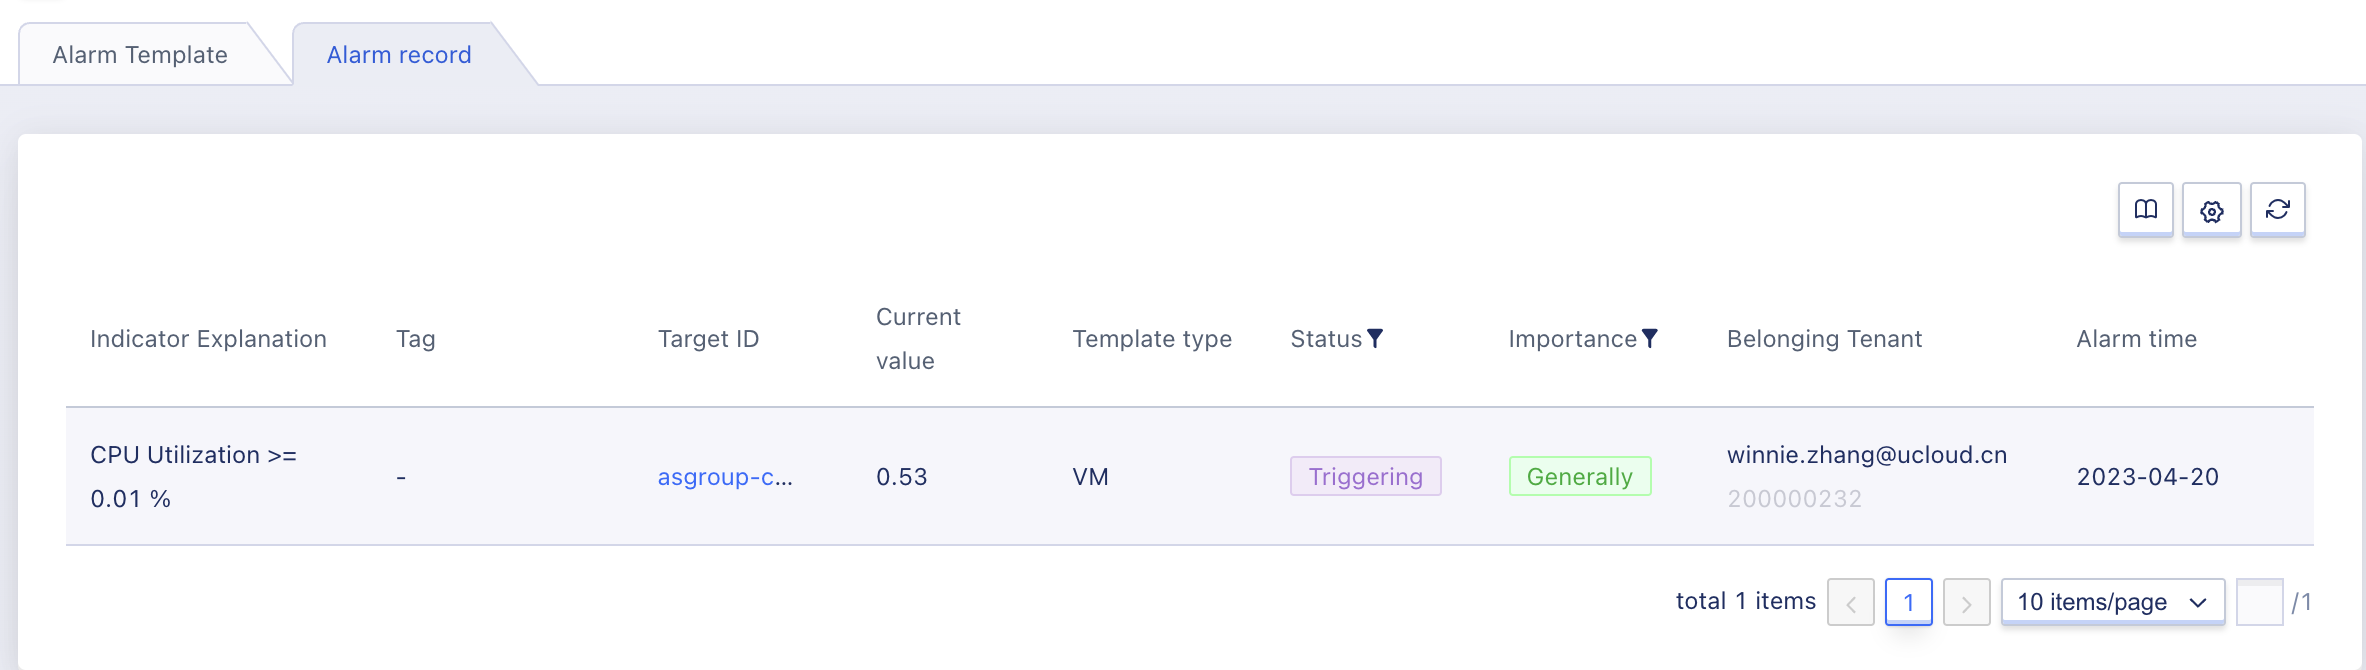
As shown in the above figure, the alarm record list information includes the indicator description of the alarm, the target ID, the template type, the label, the current value, the status, the importance, and the alarm time.
- Indicator description: The resource monitoring index item that triggers the current alarm record, i.e. the data source.
- Template Type: The resource type and resource that triggered the current alarm record.
- Label: Data disk information displaying disk space utilization metrics.;
- Target ID: Resource ID of the alarm template monitoring.
- Current Value: The data value of the monitored index of the current alarm record when the alarm is triggered or recovered.
- Status: The current status of the alarm record is divided into triggering, pending triggering, and not triggering, and the status can be filtered according to the requirements.
- Importance Level: According to the monitoring rules, the current alarm record’s importance level is displayed, including danger, important, and general. Alarm records can be filtered according to requirements.
- Alarm time: The specific time when the alarm rule is triggered.